How To Measure Content Success With Google Analytics

Forged in the fires of search algorithm updates and inbound marketing strategy, content marketing has been at the forefront of SEO strategy for many organizations for over a decade. Since the rise of modern content marketing and the focus on using content to nurture and educate prospective customers, there have been measurement challenges: from many marketers focusing on vanity metrics to the more advanced issues of rank changes and organic traffic.
In the words of Avinash Kaushik, “You Are What You Measure,” which in many cases leads to poor decision making simply because we are not measuring the right things. Ultimately, we must shift the focus away from metrics like ‘time on page’ and move towards metrics that actually matter to the overall business. Fundamentally, we need to understand how on-site content marketing initiatives (e.g. blogs, resource centers, etc.) impact revenue, customer acquisition, and customer retention. It’s obviously not as simple as saying this blog post was worth $500, but this is where our selection of KPIs (key performance indicators) becomes important.
Below, we’ve included a number of KPIs that can be used for content measurement, although it’s important to always continue searching for additional KPIs. Nearly every article that covers this topic seems to focus almost exclusively on out-of-the-box dimensions and metrics in Google Analytics. While some of these reports can be useful for content measurement, Google Analytics really shows its value when you’re using Events and Custom Dimensions.
- Scroll Depth: Incrementing scroll depth by % allows for a content consumption KPI that informs knowledge of how many users even see a certain amount of the content. A trigger for Scroll Depth was recently added within Google Tag Manager, and Simo Ahava has a great tutorial on the topic. Additionally, you can use anchor points on a page to determine how many users reached a specific section.
- Engagement: Ah, the enigma that is engagement. Using an event timer on a page to listen for user interaction is a very solid metric when compared to an “Avg. Time on Page” metric, which is inherently misleading. Simo Ahava also has an excellent article on configuring a custom metric for engagement.
- Video Engagement: How effective is that video you spent hours working on? Do people even watch it? It’s easy to puke data and share metrics like the number of plays, but what if no one continues watching after the first few seconds? Setting up video tracking in GTM (Google Tag Manager) has recently become even easier with the YouTube Trigger.
- CTA (Call To Action) Interaction: Setting up click tracking across all CTAs on your page will not only provide more insight into how many users show intent, but also where they are on your page. This is particularly important if you have a CTA in the middle and bottom of the article.
- PDF Clicks: Surprisingly, many organizations share a wide variety of resources on their websites but have no way to know how many users are downloading their white papers and eBooks. You can learn more about setting this up on Google’s Analytics Help site.
Getting event tracking configured is a great start, but still leaves us with a void to align with our business goal – revenue! In order to truly understand the effectiveness of our content, we must combine various dimensions within Advanced Segments.
Advanced Segments
Using a “Conditions” segment, we can group users at the user or session level by certain event values they generated. Once we have generated a segment, we can apply it our conversion reports to understand the incremental difference associated with users that performed a certain action vs. those that did not.
Advanced Segments offer almost unlimited flexibility within Google Analytics
For example, we could look at:
- Page Views: Users that viewed an article vs. those that did not
- Entrances: Users that entered on an article vs. those that did not
- Scroll Depth: Users that saw at least 50% of an article vs. those that did not
- Video Engagement: Users that saw at least 25% of a video vs. those that did not
- CTA Engagement: Users that clicked on a CTA vs. those that did not
Now we can see the various increments associated with content engagement around our top KPIs, including conversion rate, transactions, and revenue:
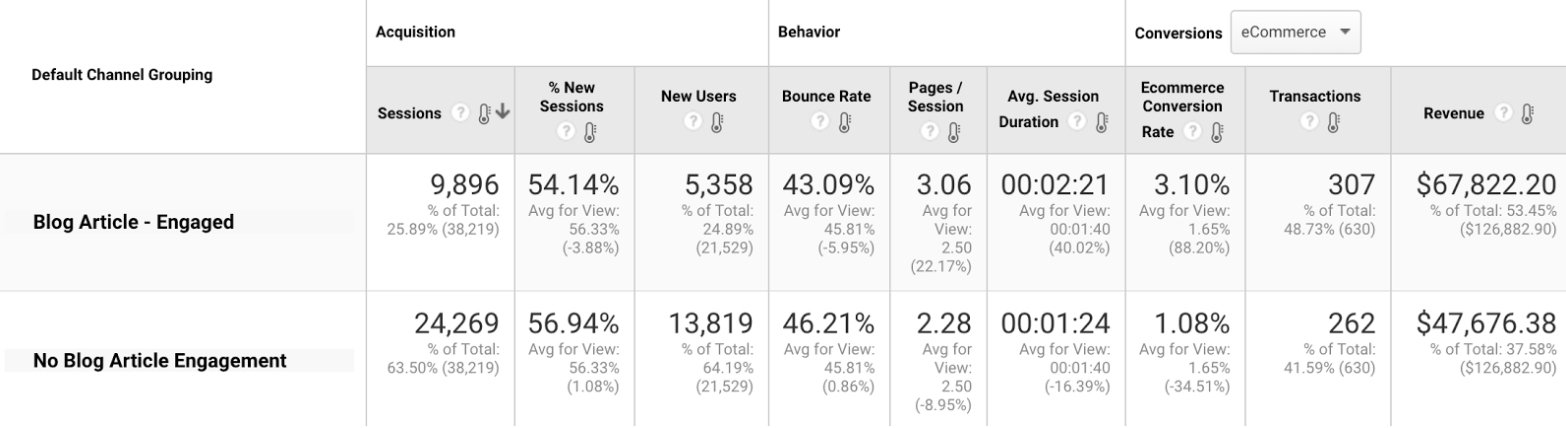
Comparing those that engaged with blog articles vs. those that did not, we see a significant lift in conversion rates
In addition to looking at revenue, we should also look at cursory metrics such as Add to Cart and Initiate Checkout. Although it’s always important to understand where the drop-off occurs within a funnel, it’s particularly important to understand how informed visitors interact with conversion steps compared with those that have not engaged with content on your site. Of course, it is important to continue tracking the growth of unique users and sessions, but by leveraging these additional steps, you’ll be able to connect the dots and ensure effective measurement of content marketing as it relates to revenue.
While this article seeks to provide further insight into advanced content marketing measurement techniques, there is an almost unlimited number of ways we can leverage the tools at our disposal to discover incrementality associated with content.


Responses