As you can probably infer from the word itself, infographics are graphic visual representations of information. For audiences, great infographics organize data in a systematic and visually appealing way to present valuable and interesting information quickly and clearly.
From a digital marketing perspective, infographics are fantastic for generating a diverse range of inbound links, building brand visibility online, and driving potential referral traffic when done correctly.
Here are ten best practices on how to create and publicize infographics so they can be beneficial for your audiences and make a positive impact in your digital marketing campaign.
1. The Info – present pertinent information and data that your intended audience will engage with and appreciate.
Needless to say, great “info” is an essential component of great infographics. Before creating an infographic, evaluate your brand, your product and your audience first. Once you have a clear understanding of what is relevant to your company and your target demographic, brainstorm a list of ideas to deliberate over and choose from. Upon ensuring that your ideas are of value to your audience, be daring and creative.
Avoid the following types:
- Topics that don’t pertain to your audience
- Cliché or banal subject matters
- Useless or unverified information
- Overly broad or exceedingly complicated issues
 Once you come up with several topics, discuss them with the other decision makers on your team and pick the one you like best.
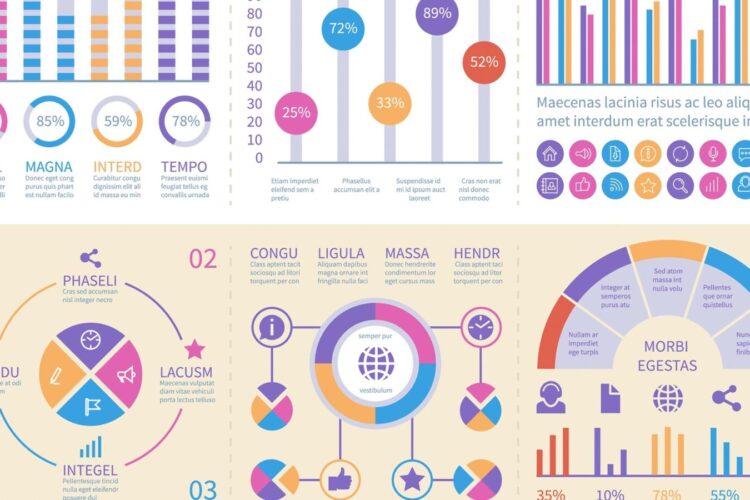
2. The Graphic – employ visually appealing graphics and showcase them in a balanced and consistent manner.
Of course, the other crucial component of an infographic is the “graphic.” Aside from being captivating, the graphics should also complement the overall theme of your content and brand. Graphics such as charts and tables can help to condense convoluted data, so be sure to keep them simple and easy to digest. The color schemes and typography used can help enhance or detract from the infographic, so be mindful of your choices. Your graphics don’t have to be overly colorful and the fonts you employ don’t have to be super fancy, but they should be fitting for the topic as well as the overall theme of the infographic.
3. Inform with “Info” and Engage with “Graphics” – conduct thorough research to create a copy deck and outline the visuals in a wire frame.
Double check again to confirm that your topic is not too broad and can be covered in one infographic. Then, for the “info” aspect, conduct extensive, methodical research and draft a copy where the relevant information you want to impart is presented in an organized and cohesive manner. On the “graphic” side, envision how to convey this information with a stimulating, captivating design that will “show” the story and enable your audiences to visualize the data. Keeping this goal in mind, design a wire frame as a visual scaffold to build upon. The copywriter and the graphic designer may not be the same person, but because the “info” and “graphic” have a symbiotic relationship, it is vital that the copy and the graphic supplement and enhance each other.
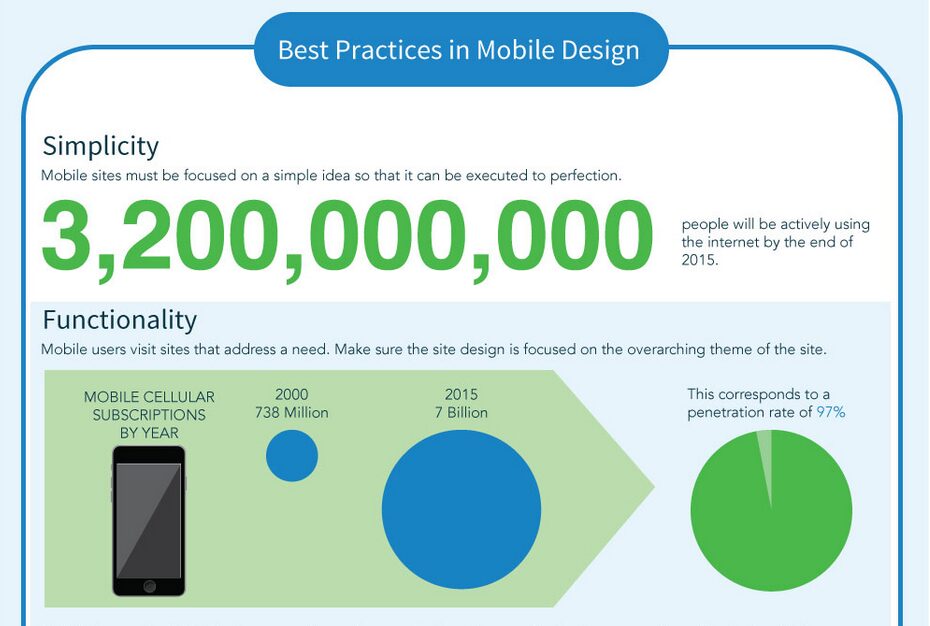
4. Balance Between “Info” and “Graphic” – strive to achieve an equilibrium between the “textual” and the “visual” within in your infographic.
Creating an exceedingly text-heavy infographic may defeat its purpose and bore the audience. However, having too much visual and not enough information may make the infographic insubstantial and pointless. Depending on the topic and nature of the infographic, try to find a good balance between the written information and the illustrations. Of course it doesn’t have to be a 50-50 split, but unless the visual is self-explanatory, always provide a written description so that it is not just a pretty picture.
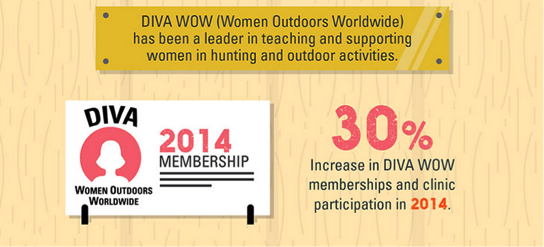
5. Make a Great First Impression – make people want to check out your infographic, whether it is with a catchy title or the overall appearance.
Having a beguiling or interesting title can help draw attention to your infographic, sometimes even before it’s seen. An equally great way to make a strong first impression and invite your audience to learn more is to ensure that the overall look and feel of your infographic is attractive. Here are some shortcomings to avoid in terms of the visual appearance of your infographic:
- Making the page too busy or cluttered
- Employing the wrong format and style for the topic
- Including too much data or text on one page
- Using unappealing color scheme or unintelligible typography
- Featuring mediocre or irrelevant imagery

6. Infographic not “Infomercial” – refrain from using the infographic as a form of advertisement for products and services your company has to offer.
It’s the perfect opportunity. It’s very tempting. But don’t do it. Infographics are not meant to be mediums for you to promote your company’s products and services. An infographic should provide useful or interesting information without the intention to sell. The fact that an infographic isn’t an ad is part of what makes it appealing to people, and thus it will lose its value entirely if you make the infographic a part of your product-push strategy.
7. Size Matters – your viewers’ attention span is limited, so be cognizant of your infographic’s length.
Unlike blog posts such as this one, an infographic should engage the audience quickly and present information in an extremely clear but succinct manner. Try to keep the infographic at a good length so that your audiences don’t lose focus, and compress the infographic size if needed so it doesn’t increase the page’s load time. Another very important question to ask is, “can people view this infographic on their mobile phones?” A lot of your audiences will be viewing the infographic on small screens, so definitely keep mobile-compatibility in mind during the creation and implementation process.
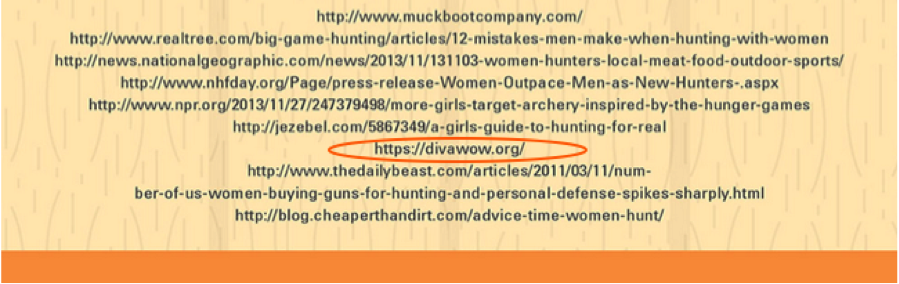
8. Give Credit Where Credit is Due – it is absolutely vital to utilize credible sources to create the infographic and cite all the sources you use.
The data and information presented in infographics often come from a smorgasbord of sources. Make sure to use valid, reliable, and up-to-date references when creating an infographic, and always cite them and give proper credit. You can attribute a statement or a statistic to specific sources within the body of the infographic. However, a best practice is to always provide the full list of sources you used for the infographic at the end, including the ones already mentioned in the body.
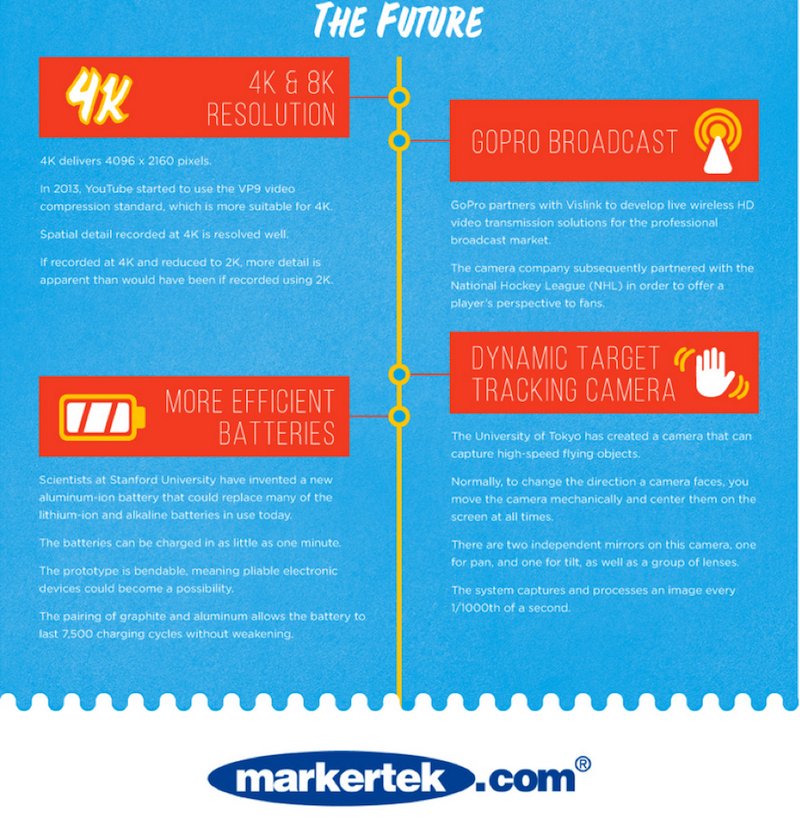
9. Take Credit Where Credit is Due – if you created the infographic, take credit by including your company logo in an unobtrusive but visible manner.
Although the infographic is not utilized for self-promotional purposes, it’s important that you take the credit for creating this great piece of content by including your company logo in the infographic itself. The logo should not detract from the overall aesthetic appeal or topical focus of the infographic, but instead, it should be on the bottom of the infographic serving a similar purpose as “end credits” in movies. It is a subtle but effective way of building brand visibility.
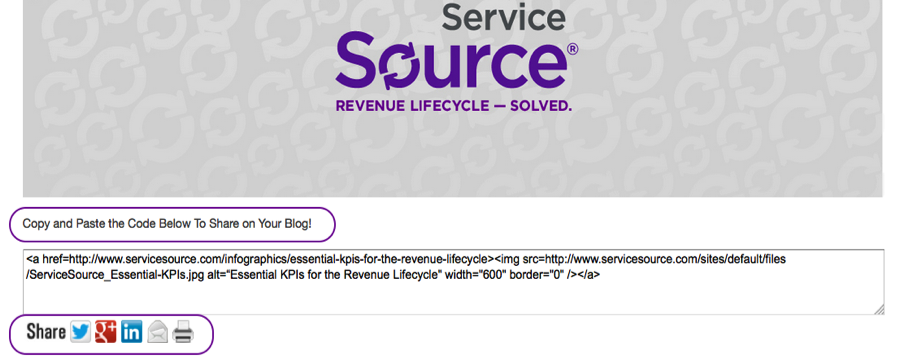
10. Linkable and Shareable – ensure that the infographic can be easily shared by other websites and on social media.
It’s beneficial to create a separate landing page for the infographic with a simple URL that includes the title of the infographic. Draft an introductory paragraph for the infographic and optimize the page with proper meta data. Once the landing page is created, provide an HTML embed code underneath the infographic so that others can share it on their own websites. Double check to include the correct website URL, image destination URL, and image ALT tag in your embed code so that link equity is passed on to your site when others use the code to implement the infographic elsewhere. It’s also helpful to place social buttons near the infographic so that any reader who engages with the content can readily share it on their own social media channels. Encourage others to help publicize the infographic by adding a call to action such as “if you enjoyed it, please share…” Of course, you should always promote the infographic through your own social media and email marketing efforts.
Additionally, you can find a list of relevant sites, influencers in your industry, and infographic submission sites to actively earn links for the infographic, but make sure to have different introductory paragraphs written for each individual site that the infographic is placed on. Great infographics have the potential to go “viral,” so definitely take advantage of this quality content to engage your audiences and boost your brand visibility online.
I hope you find these ten practices helpful. Please comment below if you have other suggestions!