

By now, in 2019, it seems that a substantial portion of businesses realize the importance of content. Company blogs, once seen as a hip “nice-to-have” for a business, have become fairly commonplace.
But now that marketing managers, directors, CMOs, and business executives have bought into the idea that a fully-formed and well-executed content strategy should play a key role in achieving business objectives, these leaders are now asking hard, but reasonable, questions:
- “What’s the ROI of my content marketing?”
- “Why am I paying all these writers?”
- “How does content impact my business’ bottom line?”
The problem in answering these and other questions is that the impact of content is notoriously tricky to measure. In 2017, the Content Marketing Institute found that 59% of marketers did not have a clear understanding of what success in content marketing looked like. Broadly, what makes this so difficult is that there are many definitions of what “content” means. Does content refer to a blog? A category page? A landing page for a gated resource? An FAQ section?
The answer, of course, is all of the above.
However, each of those 4 content types can and should be measured against a different set of expectations and KPIs. And so, in this article, I’m going to look specifically at the blog—the blog being the site area content marketers most commonly contribute to. I’ll demonstrate a methodology we’ve developed at Wpromote that allows content marketers a way to attribute bottom-line impact using Google Analytics by using the Ecommerce Report for B2C organizations or Goal Report for B2B organizations.
The actual steps to executing this are rather simple; it’s the story around it that is more important. So we’ll start there, with a key positioning statement, because the data you’ll collect will require a proper explanation and way of thinking about it. If you’d prefer to get straight to the method, feel free to scroll down towards the end of the article.
Blogs Are Not Product or Service Pages
I’ll share a little secret: I do not expect my blogs to sell anything, and I am upfront about this with my clients from the start. If they do, great, but it isn’t my goal. While this might sound like a great way to get my service cut, it’s actually not. Why?
Think about what a blog really is. It’s an online journal that’s meant to educate, inform, entertain, or any number of things. It’s writing. It’s storytelling. Selling is antithetical to what a blog is, and what it does.
This is how I encourage my clients to think: selling is what your product pages and service pages are for. They are the pages with the product information, the images, the reviews, the add to cart functionality, all of it. While you can add elements of these pages to a blog by writing and discussing branded products, product images, and so on, the blog will never outperform a product page in its ability to sell.
So why hold a blog accountable to the same performance goals and KPIs as one of those pages, as many marketers end up doing? Let’s take a brief look at two common methodologies for measuring the impact of a blog, and why they are inappropriate choices for measuring a blog’s business impact.
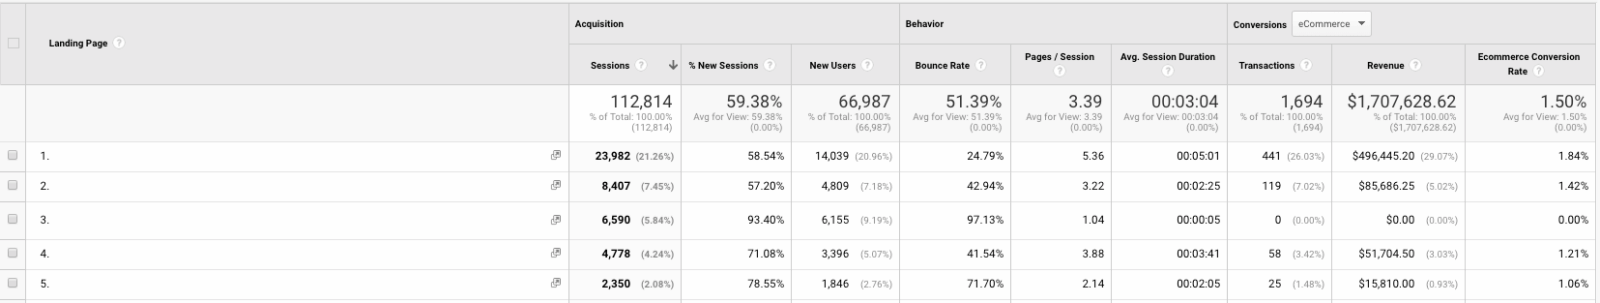
Measuring Impact, Method #1: Using the Landing Pages Report
This is often the first place marketers look when they want to measure the impact of their site’s content. It’s a very useful report for a lot of use cases, particularly in its ability to associate conversions with pages. It’s also a frequently misunderstood report, particularly for measuring a blog’s impact. This is for two reasons.
1) The Landing Page Dimension
Landing Pages report, in Google Analytics, uses “landing page” as its primary dimension by default. A landing page is defined as the first point of entry—the page a user “lands” on. The metrics that follow are all associated with this dimension. This means that data is only collected once a user begins a session with that page. This means any conversion activity must begin by landing on a page, whether this is an organic entry from a search engine, a link shown in an email, or a paid advertisement from Google or a social media platform.
This means, for instance, if a user finds you from your homepage, clicks on a product from your top navigation, reads the information on the product page, clicks add-to-cart and buys, credit will be attributed to the home page by default in the landing page report.
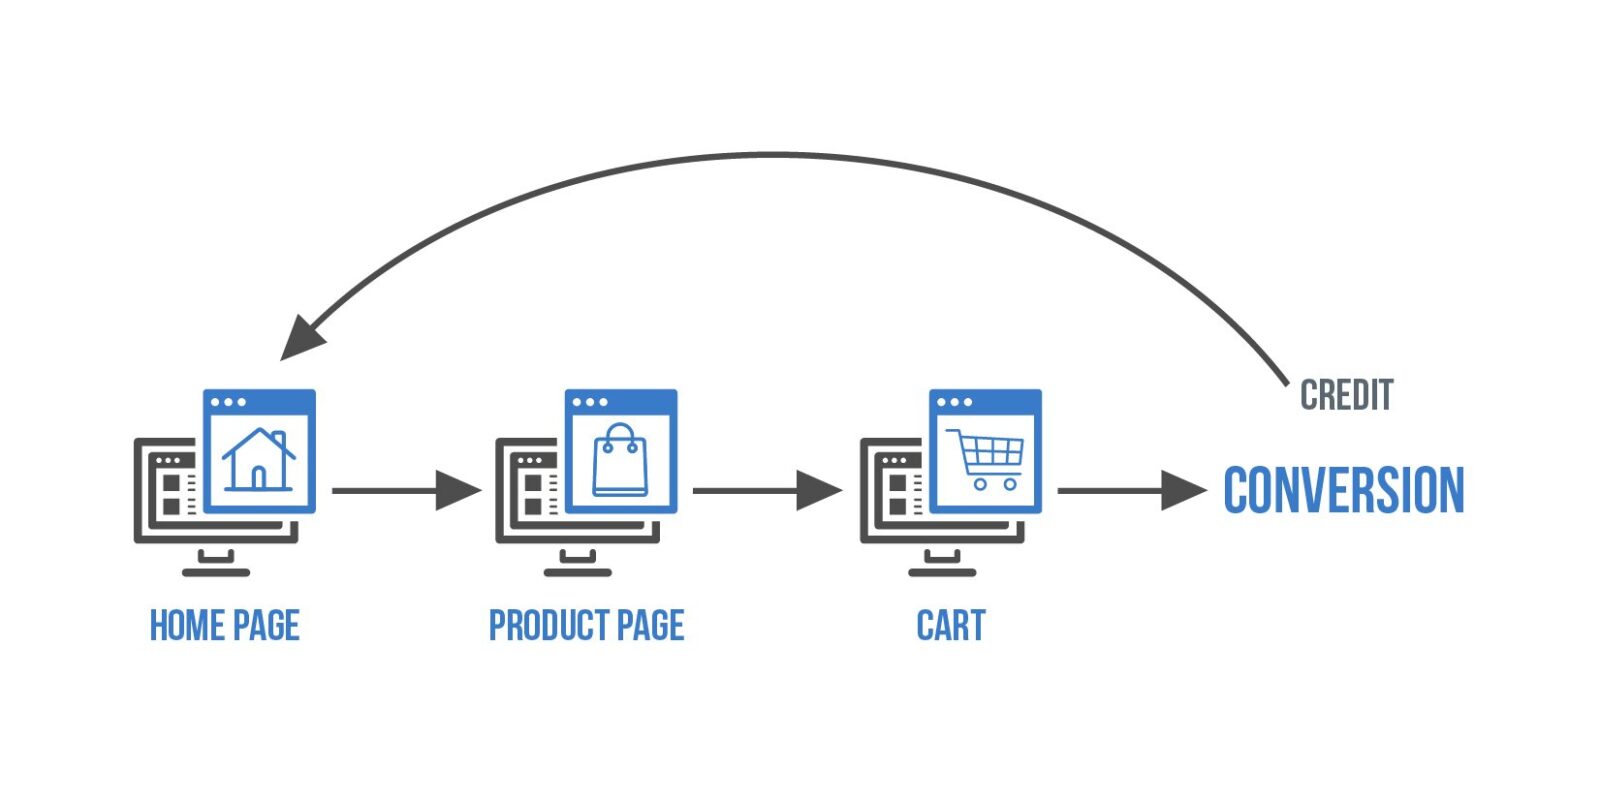
The home page didn’t do much of the selling. It’s the front door to your site. The product page did the bulk of the selling. Assigning credit to the home page would be like attributing the brand’s logo or the posters outside a brick and mortar store with a sale made inside, which nobody would ever do—but this, in a nutshell, is what Landing Pages report does, and it informs the way marketers think about their site’s content.
A blog is often found via organic search, yes, and so you’ll often find your blogs here, and it will be tempting to look at their conversion performance to judge their performance. However, doing so unfairly stacks up blogs, which have the intent to educate, alongside product/service pages, which have the intent to convert.
While some people might read another article, or click to a product, the vast majority will not because that’s not what they came for. They came to have a question answered, which hopefully your blog delivered.
What’s the second issue with the landing page report?
2) Session-Based View
By default, the Landing Pages report takes a single-session-based look at performance. It answers the question: “What actions did the user take in a single session on the site before leaving?”
This poses an issue for blogs, which as previously stated, don’t usually have selling as their primary purpose (and shouldn’t). It’s extremely unusual, although it does happen, for someone to enter via a blog, navigate from a blog to a commerce-related page, and make a purchase, all in the same session.
If this does happen, credit will be assigned to that blog article in the Landing Pages report, and everyone will feel good about it. However, this is extremely rare, and furthermore, should not be expected to happen because it does not square with how people actually shop and use the internet. But don’t take that insight from me, take it from Google.
In December 2018, Google produced a fantastic interactive infographic that allows people to explore the paths to conversion of four different templated users, illustrating just how many interactions with a brand a user often has. In all cases, users took dozens, even hundreds, of interactions across a variety of platforms with many different pieces of content before eventual conversion.
A session-based view captures very little of this truism about online commerce. People don’t just show up to a website and buy—their purchase is the reflection of a number many smaller steps, online and offline, taken before buying. Very often, one (or several) of these steps is reading a blog a brand published. A session-based view will capture not capture this crucial part of the story.
Essentially, what the landing pages report answers is: “Which pages pushed people over the finish line to purchase?” It does not take into account what pages or steps a user took that got them to arrive at the point of conversion. By only looking at the landing pages report, you’re getting an extremely narrow view of what actions your users took before purchasing, which may lead you to focus on a correspondingly narrow list of activities and initiatives to drive more business.
How do you get a more complete view of your user journey? Some savvier marketers turn to Assisted Conversions.
Measuring Impact, Method #2: Assisted Conversions
The Assisted Conversions report—and its related report, Top Conversion Paths—is a supremely useful report, particularly for its ability to illustrate cross channel interaction.
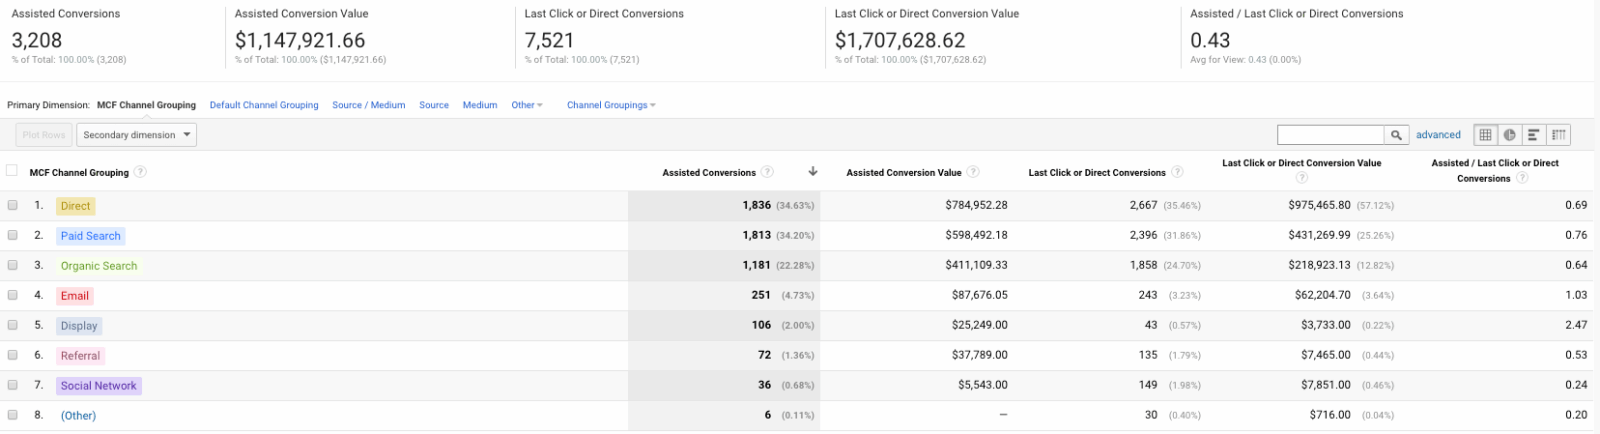
It paints a broader picture by showing how the different marketing channels interact with each other, and assigns an “assisted” conversion to a channel that wasn’t the channel that actually gets credit for the conversion, which helps spread the credit around to the other channels. This is a good thing because it paints a clearer and more complete picture of the user’s journey, and it’s an improvement over the session-based bias of the Landing Pages report.
Clever marketers will know that this report’s primary dimension can be adjusted from the default “MCF Channel Grouping” to “Landing Page” to give a similar view at the content level, showing what assisted conversions may be assigned to a particular landing page. If you go this route, and set a filter for your blog (/blog/ for instance) in the Assisted Conversion report, you’ll see a lot more conversion activity to get excited about than you’ll see in Landing Pages report
However, If you’ve been following along, you’ll recognize the problem here: the landing page dimension, which again, only captures data of the first page in a user’s session. This means that any blog discovered by other means, such as in the top navigation, category content, or even the category page itself, as POLYWOOD does, will not be counted in this report, and no credit will be awarded.

The Assisted Conversions report is a better way to judge your content than using the Landing Pages report, certainly, but the Assisted Conversions report’s reliance on the landing page dimension limits its scope and its usefulness.
There is, however, a better way. And that way is to use Advanced Segments.
A Better Way to Assess A Blog’s Performance: Using Advanced Segments
An Advanced Segment is a Custom Segment you can create in Google Analytics that groups users in conditions that you define. Once the Advanced Segment is enabled, you can use it to view any of Google Analytics pre-configured reports to look at how that audience performs and what actions they take, including the Ecommerce Reports and the Goals Reports.
Advanced Segments are extremely powerful tools, and allow you to get fantastic insights on audiences that you determine that are important—for instance, your blog audience.
The power of the advanced segment to measure the impact of your blog lies in its simplicity. To create an audience for your blog, you need to take only 3 steps, but an optional 4th allows for even better insights. If you do complete the optional step, you’ll further refine your audience to only group the people who interacted with your blog prior to conversion.
-
- Create a segment by clicking +Add Segment and press +New Segment
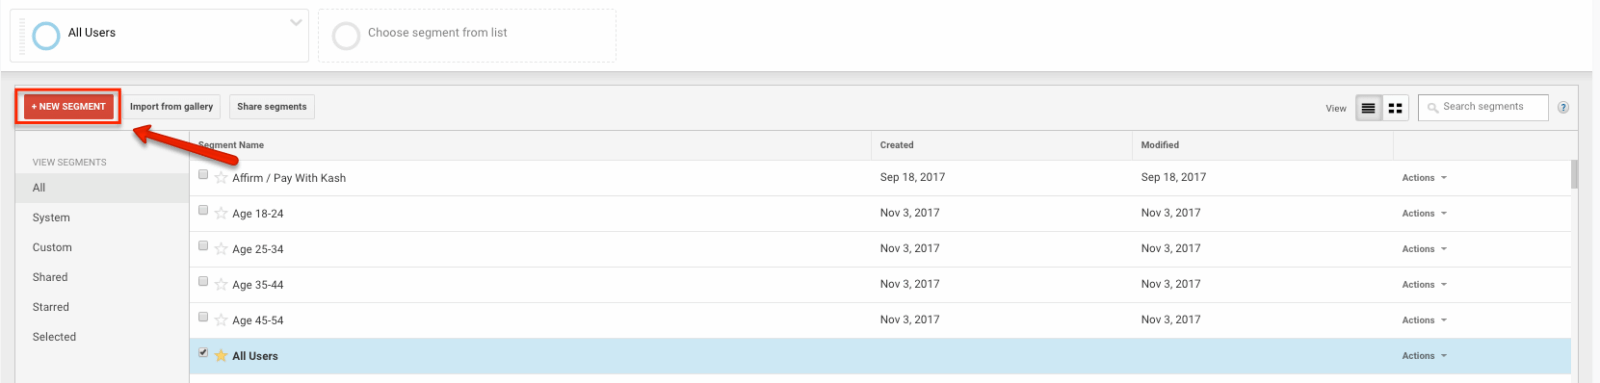
-
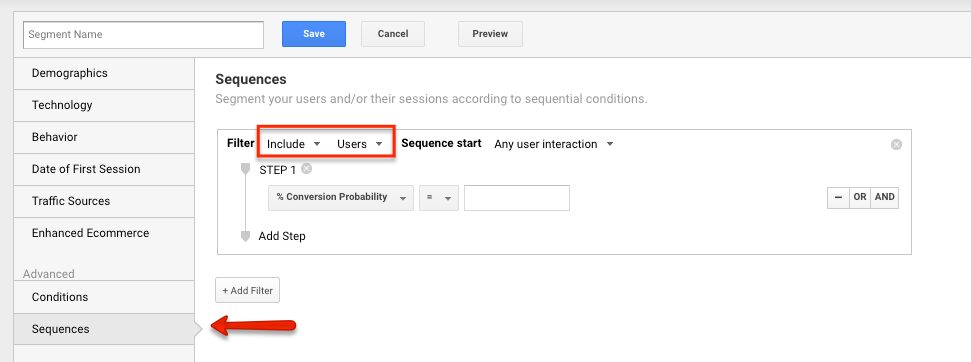
- Go to “Sequences” under “Advanced.” Switch the filter from “Include Sessions” to “Include Users”
-
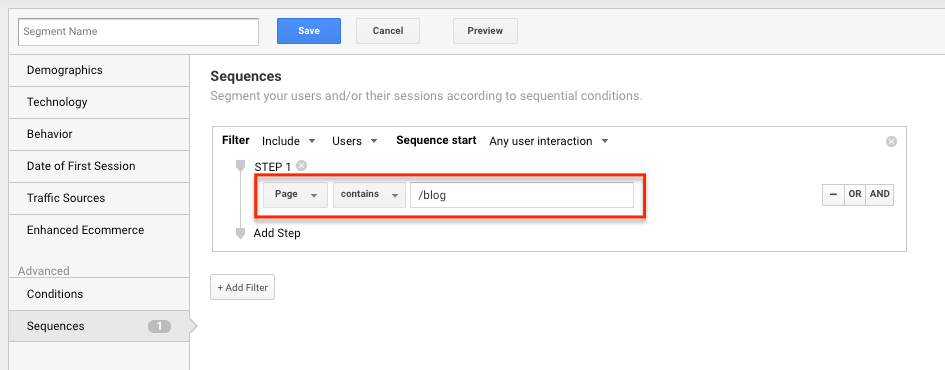
- Change the Dimension in Step 1 to “page” and specify your blog’s subcategory (/blog/, etc.)
-
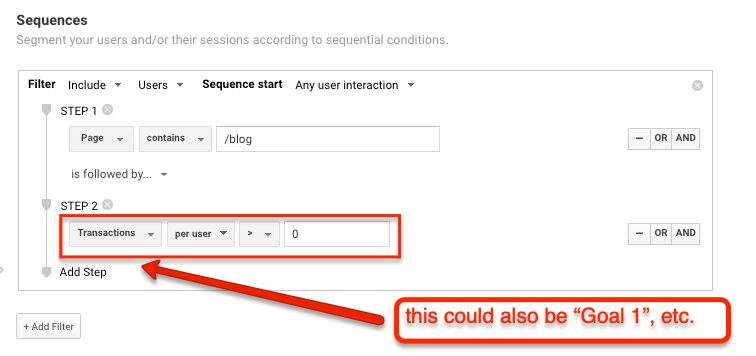
- If you’re interested in Ecommerce, set the dimension to “Transactions” per session > 0
- If you’re interested in lead generation or goals, set the dimension to the goal you’re interested in measuring the performance of, and set it similarly to > 0(Optional) Add a Step 2.
Press Save.
What you’ve now done is created an audience that, as a requirement, has interacted with your blog at any point across their engagement with your site, across sessions. This means it doesn’t matter if the interaction with your blog was the first, last, 5th, or 26th session in their interaction with your site—if they touched the blog by any means, they will be grouped.
This resolves the major issues with the Landing Pages report, which is hamstrung by both its session-based view and reliance on the landing page dimension, and the Assisted Conversion report, which does take a cross-session view, but is similarly limited by the landing page dimension.
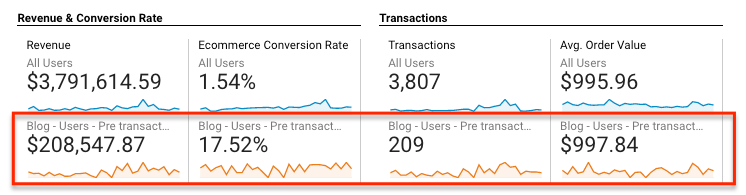
Now, with this segment enabled, navigate to the report that interests you the most: Ecommerce or Goals. For Ecommerce, you’ll see all the associated revenue attributable to your blog audience, their Conversion Rate, Transactions, and Average Order Value. For Goals, you’ll see similar KPIs.
Ecommerce
Lead Generation
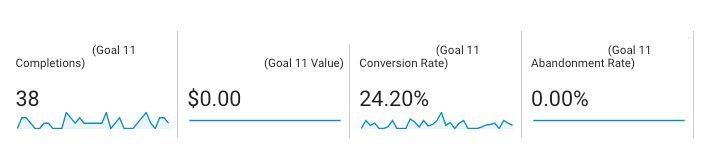
You now have the power to say the following: “Here is all the revenue (or goals/leads) that is associated with engagement with the blog.” Very powerful.
Crucially, though, it does not allow you say: “The blog caused this much revenue or this many leads.”
And that is completely fine. Blogs don’t sell, but they help to sell. They nurture. They guide. They offer a touchpoint when the user is further up the funnel and not yet ready to buy.
You’re making a correlative argument, not a causal one. Which again, is fine. You’re saying that the blog helped with this percentage, or this chunk of the total revenue or leads. This will give you a fair, honest figure to report on if you are asked to what extent is the blog helping bottom line activity for an organization you’re working with. This method properly positions the blog in its appropriate place—the support role—allowing you to accurately assess its impact and value.
Wrapping Up
This method is built around the idea that blogs are not direct sales drivers themselves, but they are an integral part of the buying process. Advanced Segments allow you to capture the data to tell this story. And, with further data processing, you can even identify which pieces of content are actually doing the influencing, but we’ll cover that in another article. That will help you answer another inevitable question you might get “What’s working, and what isn’t?”
Try this method out, give it a shot. You may be surprised to learn how much of a role your blog has been playing all along. And now with this data in hand, you can finally demonstrate it.