How To Make Data Actionable (CMO Series)

This is the first in our CMO Series–a dedicated look at the questions that drive today’s marketing leaders and the answers they need.
—————
In today’s world, there is data all around us. All this talk of big data and business analytics means that we’re making smarter business decisions, right?
Well, maybe.
With the prevalence of big data, it can be easy to dive into the numbers and overlook the context behind the metrics. However, a lack of context can cause a multitude of issues when it comes down to trying to make strategic, data-driven business decisions.
For example, major issues can surface such as:
- Meaningless metrics
- Miscommunication
- Misalignment on KPIs
- Lack of business impact
Therefore, it is critical to have context at the forefront of all data analyses. Let the business strategy drive the way you analyze data, instead of having the way you analyze data drive the business strategy.
We’ll walk through the key steps in how to take an integrated approach to data analysis and enable data-driven business decisions that lead to a high impact on the bottom line.
How To Analyze Your Data When You Have Siloed Reports
First, let’s start with a common situation you may face at work. You need to decide where to allocate marketing budget to generate more revenue, but you have siloed performance reports. So you ask for performance data from your channel managers from each team: Amazon, ecommerce, and retail.
These are the 3 reports your team turns in to you:
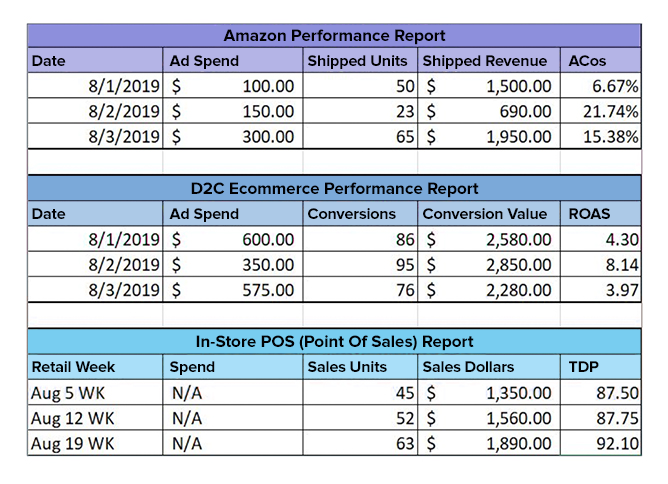
Looking at this data, what business decision will you make?
Do you invest the majority of your budget to Amazon or ecommerce? And do you know the context and meaning behind these performance numbers? For instance, does a 8.14 ROAS in ecommerce mean it’s outperforming a 21.74% ACos in Amazon?
Overall, these reports make it hard to have a clear decision on budget allocation. In order to make effective business decisions and draw actionable insights from data, you need context and strategy at the beginning.
To move away from a siloed data analysis approach to an integrated and actionable one, there are 4 key steps to making data actionable:
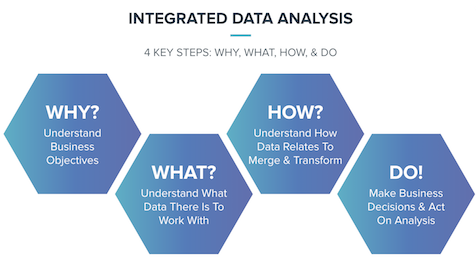 The four keys to implementing integrated data visualization.
The Why
The Why means consciously taking a step back and revisiting your overall business strategy. What business question do you need answered? For example, you might ask, how do I allocate marketing budget to drive the most revenue?
This first key step of understanding the business question ensures the time and energy invested into analyzing data and compiling a report will be useful.
The What
Once we clearly define what business question the data analysis needs to answer, we can explore if it is even possible.
In this step, we ask: What data do I have to work with?
Start by organizing your data into an Entity Relationship Diagram (ERD). The diagram is essentially a map of how all of your data is organized, interlinked, and what the relationships are between each subset.
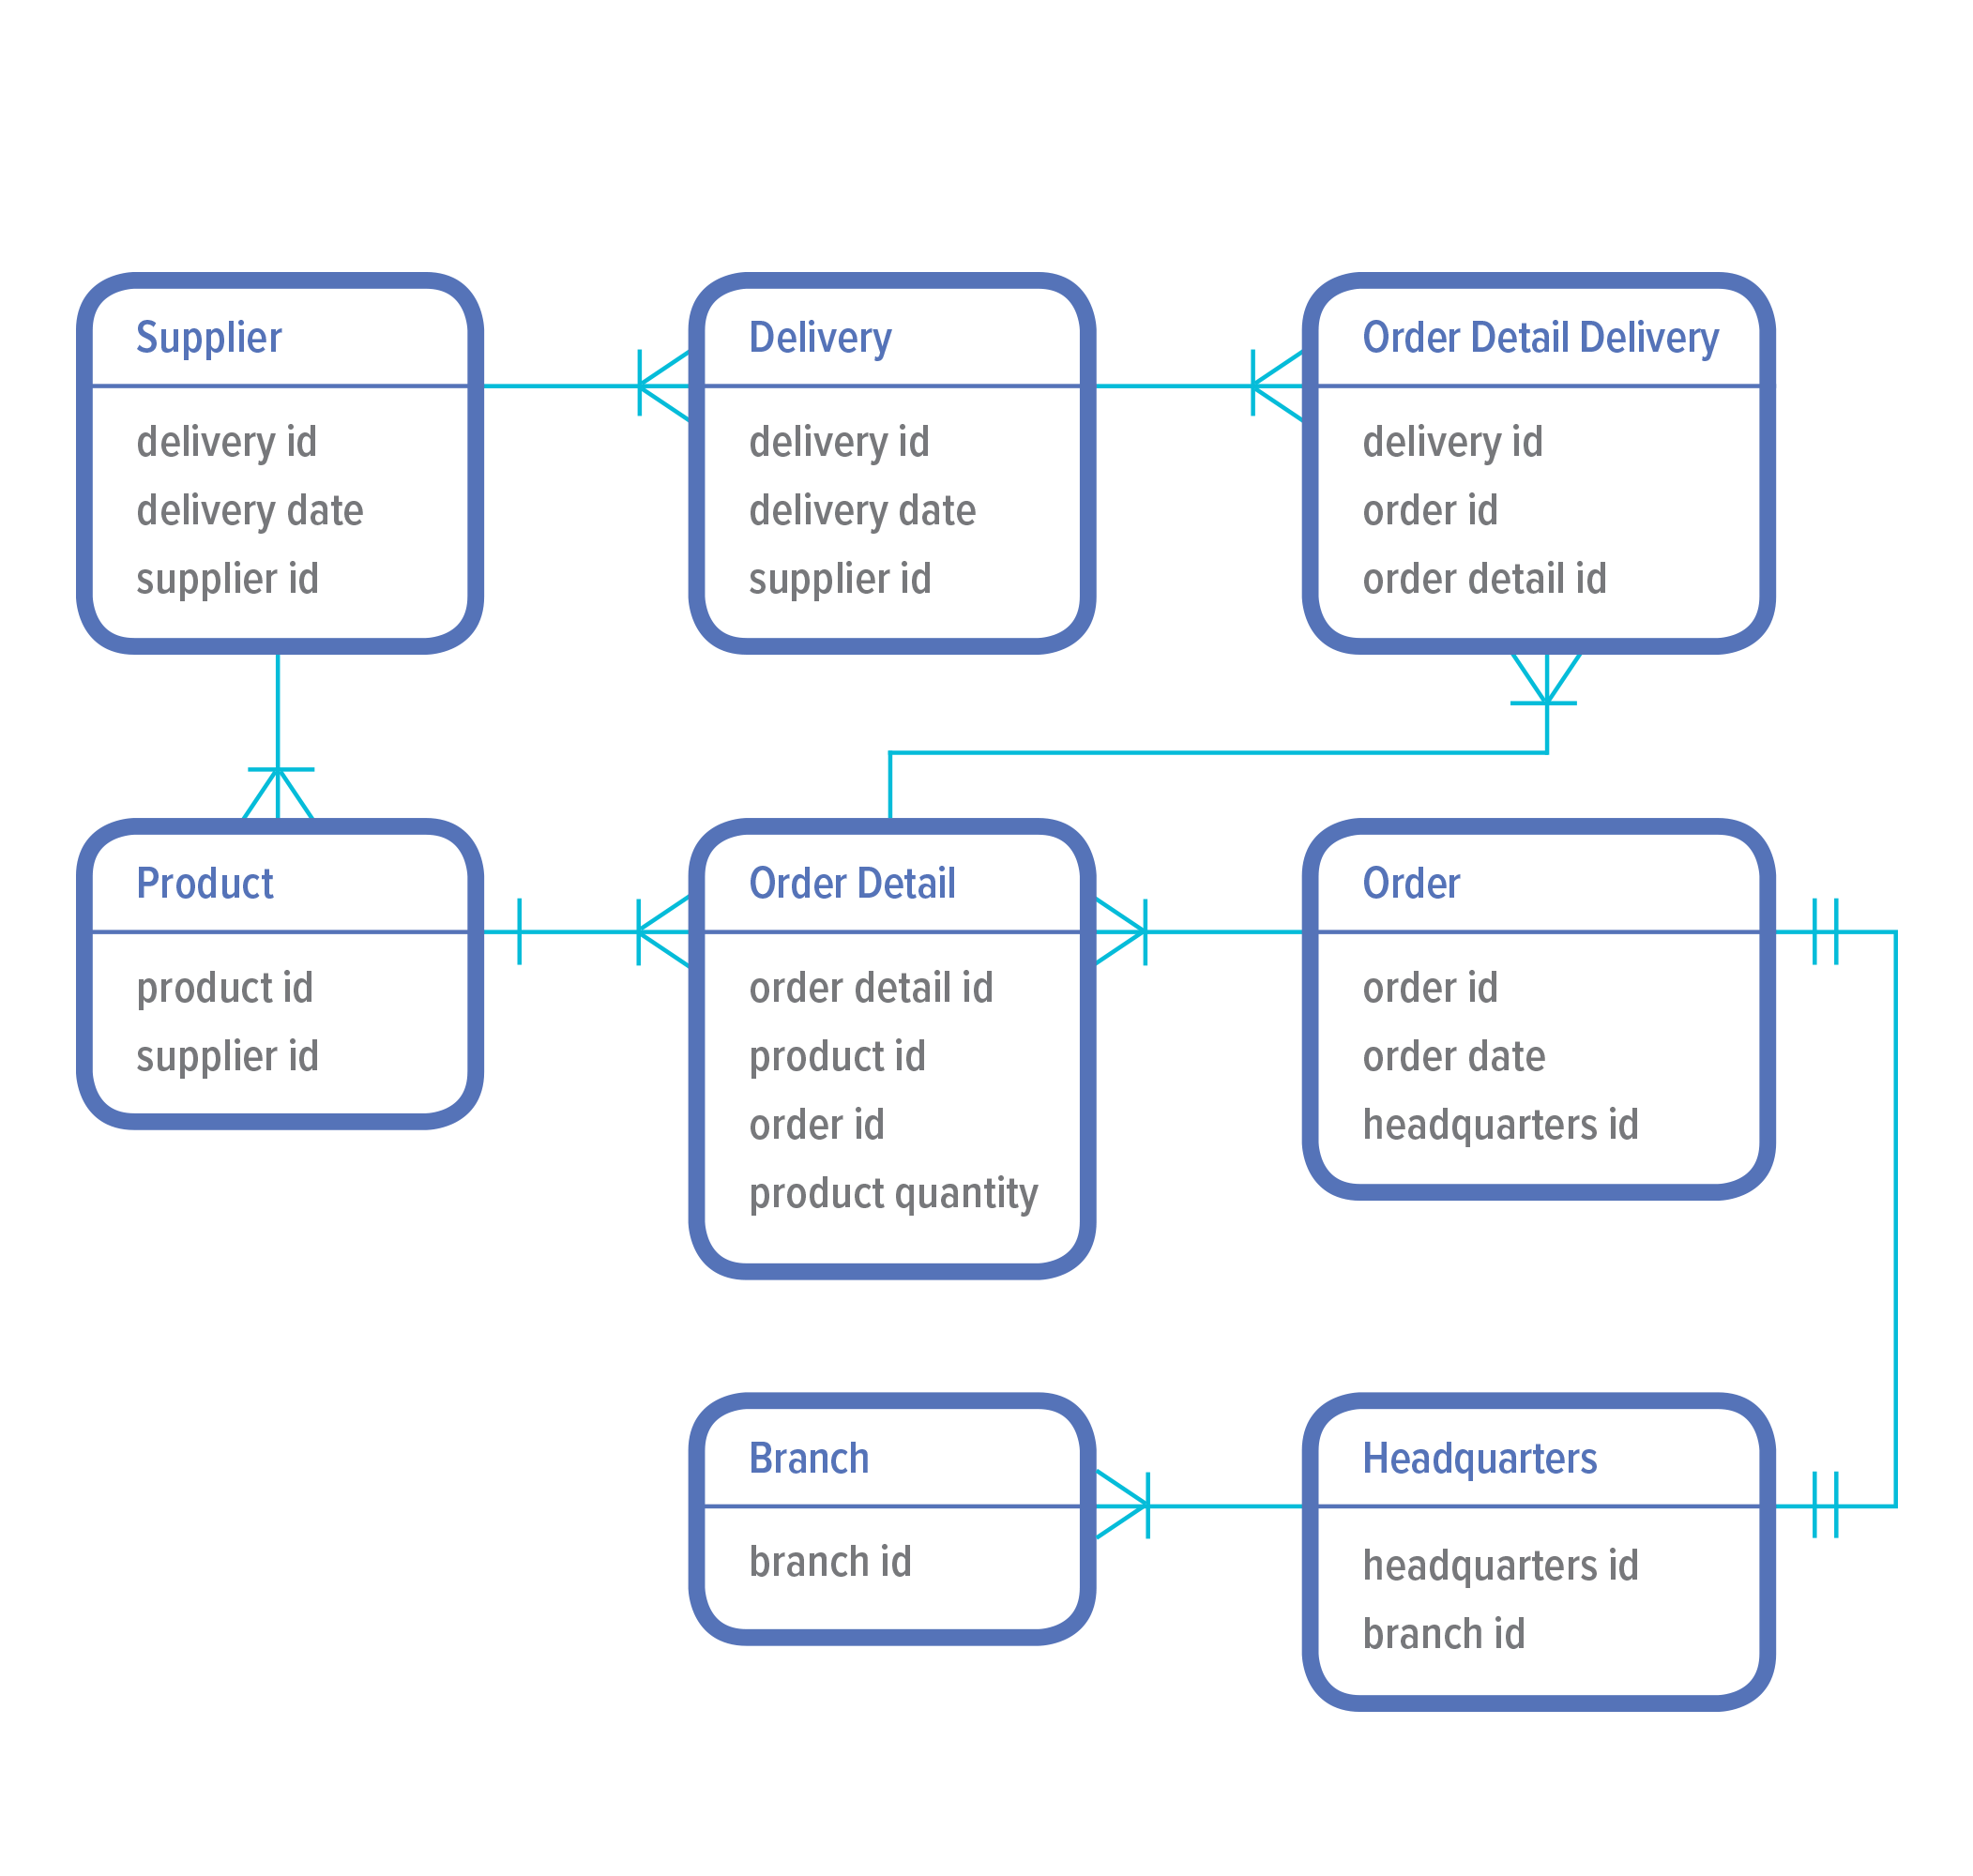
The diagram above illustrates a company’s data organization. A marketing executive could use this ERD to understand what business questions are able to be answered with the data the company has to work with. For example, from this ERD we could explore:
Which suppliers have the fastest delivery lead time?
Which products are usually bundled together for purchase?
Where is the opportunity to cross-sell and upsell different products?
There may be times when you have a business question that is just not possible to answer at present because the data has not been captured. That is totally fine! It will spark a new process of data collection, ensuring you capture those missing data points in the future, and propel your company’s integrated data analysis forward.
The How
Once you have a good understanding of what data you can leverage, the next step is to make the numbers usable and drive actionable insight.
Using the relationships and data points mapped out in the ERD, transform the data with an Extract-Transform-Load (ETL) method. This process will enable you to produce an output that answers a business question, provides insight on how to make a business decision, and drives a business action that impacts the bottom line
The ETL process is laid out in 3 main steps:
- Extract – Use the ERD to identify what data points you want to extract and from which various platforms,
- Transform – Using ETL tools such as Funnel.io or Google Big Query, transform data with SQL to merge siloed datasets
- Load – Get your final output in an integrated dataset that can be connected to a data visualization tool and have specific views that are created for each business question to answer and drive action.
The Do
Now last but definitely not least, the fourth step of integrated data analysis is all about action. It’s the Do!
The final output of integrated data analysis should be visualized in a way that facilitates a business decision being made.
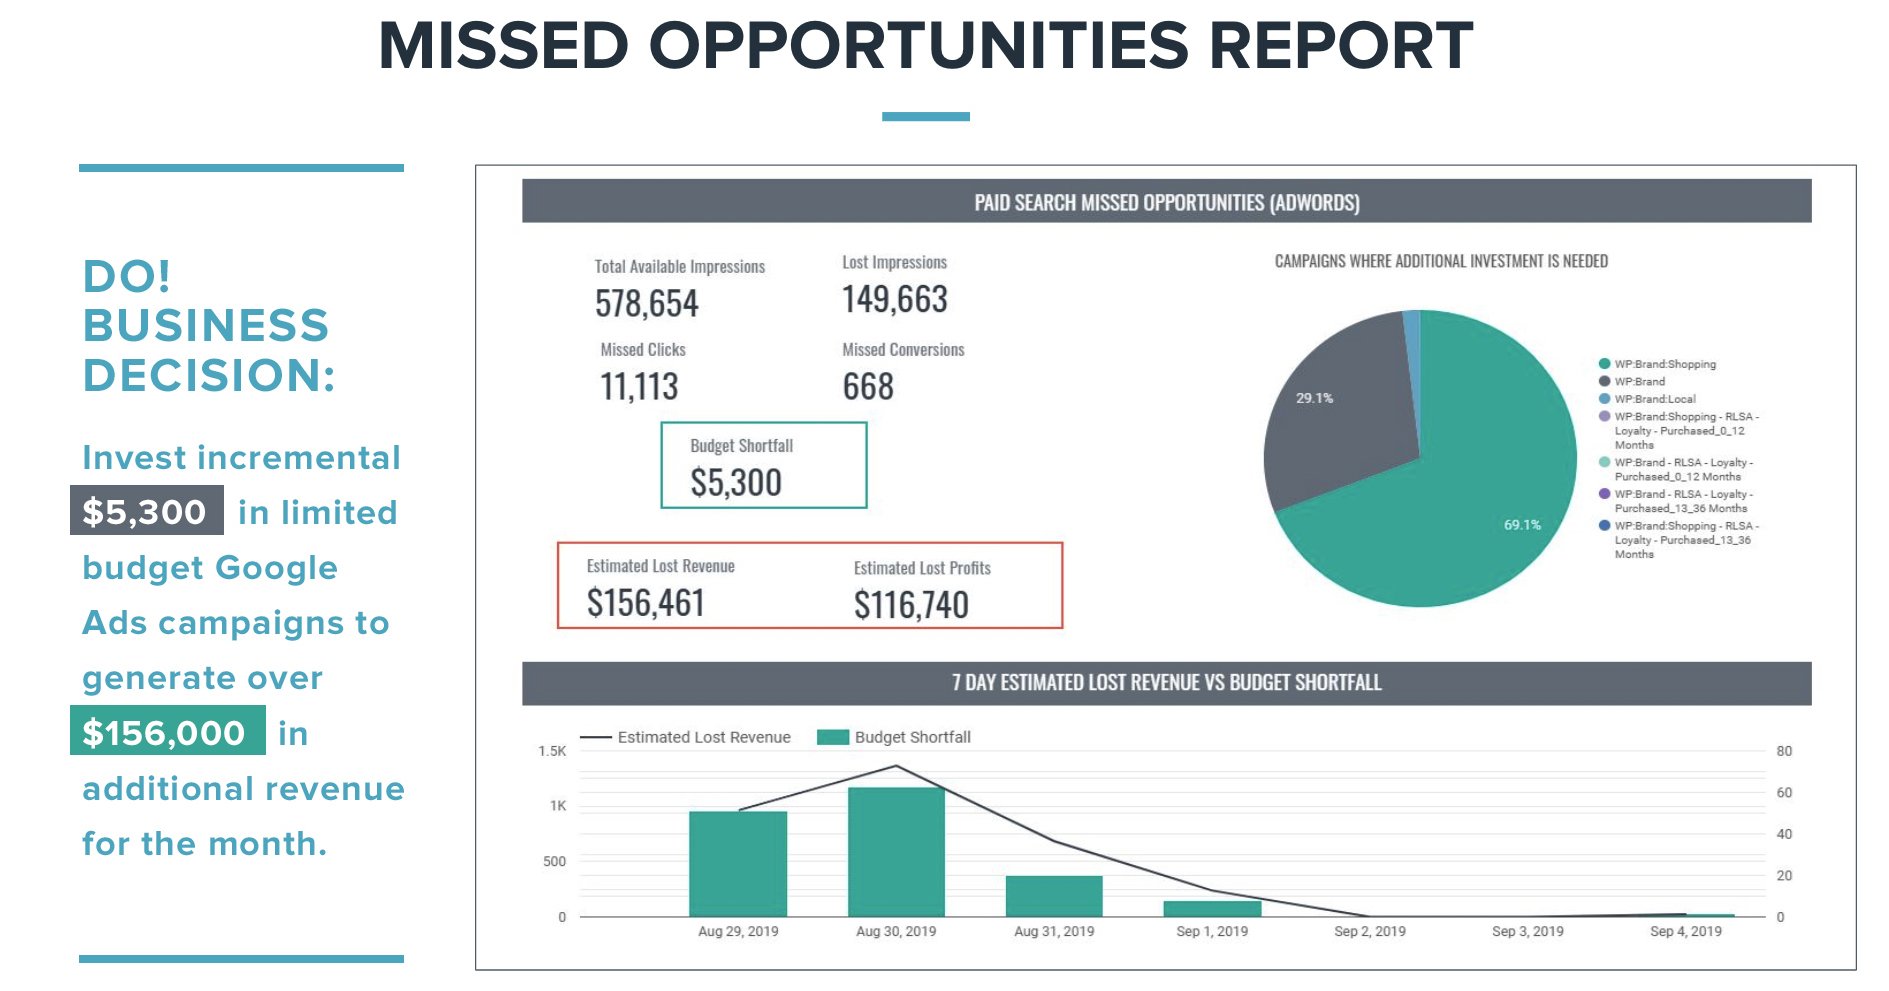
For instance, the report below was designed after a client asked where there was an opportunity to invest more to generate incremental revenue.
Before creating this report, we approached all 4 key steps to integrated data analysis:
- Why? – There was a business need for analysis on where to invest more budget within paid search campaigns because pacing for revenue goals was falling short.
- What? – Utilizing data points such as missed impression share and budget caps, we could calculate how much missed revenue was resulting from constrained campaigns.
- How? – The data points of missed impression share and budget caps were transformed with the company’s gross profit margin to analyze how much lost revenue and lost gross profit was missed due to constrained budgets.
- Do! – Based on the output above that was created to answer the business question “Where do we increase paid search investment to drive more revenue?” the visualization indicates a $5,300 increase in monthly budgets across multiple campaigns would result in $156,000 in additional revenue.
The goal of integrated data analysis is to make data-driven business decisions. Not only does it make the time and energy spent in analyzing data worthwhile, but it also allows for strategy pivots so that the business is constantly innovating.
Takeaways For Your Data Visualization
It’s worth repeating: Let the business strategy drive the way you analyze data, instead of having the way you analyze data drive the business strategy.
In doing so, data analysis transforms from siloed to integrated, informing impactful business decisions. As you find data blindspots through the four key steps, you can implement new capturing processes to add new data points.
This further drives the cycle of an integrated analysis approach by having new data provoke new business questions and strategy, ensuring ongoing growth and innovation.


Responses