
Senior Conversion Optimizer at Unbounce, Michael Aagaard, began his Mozinar last week by asking his audience to recall the last time they were really, really hungry. So hungry, that they cut corners during the cooking process and ended up with something like:

This fish stick. Burnt on the outside, frozen on the inside, and altogether unpalatable.
“If we had only preheated the oven and given it the time needed, we would have some pretty good fish sticks. The same goes with A/B testing.”
For those who don’t have time for decoding metaphors, Aagaard means that you can’t try to cook your data too quickly, or else the data will be useless. And from there, Aagard jumped into his first of five tips on how to run better, cleaner A/B tests.
Interested his A/B tips? Check out the list out below!
Tip 1: Do not use 95% significance level as a stopping rule
A common target set by A/B testers is to reach a “95% significance” level. Though he agreed that this is a good rule of thumb, he emphasized that significance and validity of data are two separate beasts, and neither can be ignored.
High data significance refers to a strong connection between whatever data we have on hand. Having data that holds true validity, the other hand, refers to data that we can glean meaningful insights from – taking into consideration factors such as sample size (users) and duration (days/weeks) required to detect a lift with certainty. All this, he recommended, should be completed before starting your A/B test.
“The purpose of A/B testing is to get a representative picture of how a variant would perform if implemented permanently in the wild,” he said. “One day [of testing] is not a representative picture [even if it is statistically significant].”
Try this tool to help with your calculations.
Tip 2: Make sure you get enough data to yield meaningful insight
Got it, so pre-calculating sample size and duration is important. But what’s the real danger of not doing so? Actually, it could be a lot. Take, for instance, the data from this graph.
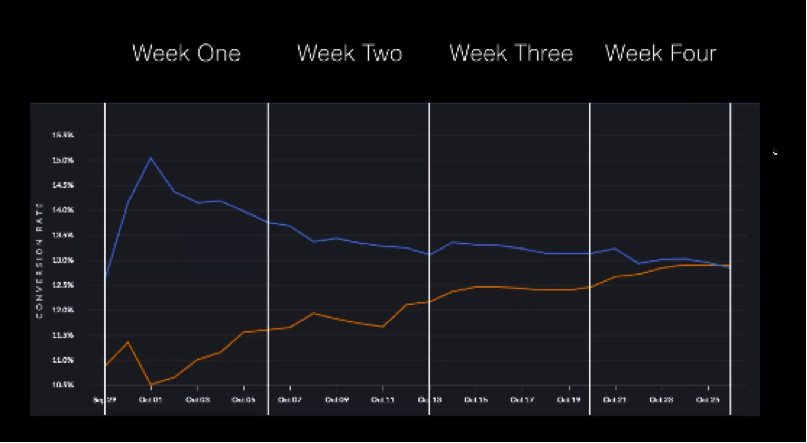
“If we had gotten over excited and stopped the test at week one, and said ‘Wow we’ve increased conversions by 120 percent!’ we’d actually be in trouble. Because, three weeks later we’d have realized we made a very, very bad decision.”
Tip 3: Be careful with averages, they hide the truth
The users that visit your A/B testing page are arriving through different devices, area codes, hours of the day and much more. When A/B testing, it is important to remember that none of these users behave in the same way and all have an effect on your results.
“It’s obvious you can’t treat all these little categories as the same thing, because then you would end up with this freak monster.”
He then referenced the data from an A/B test he conducted a while back. At first glance, it appeared to him as if there was no statistically significant correlation between test page A and test page B. Digging deeper, however, he noticed two things:
- Conversions on desktop had actually increased with the new page and decreased on mobile.
- The change wasn’t showing up on the mobile version correctly.
If Aagard had based the conclusion of his experiment on the data average, he would have thought that there was no statistical significance. When in reality, there was an inverted difference between devices – as well as a flaw in the experiment itself.
“Be careful with averages, because they can hide the truth.”
Tip 4: Formulate a data-driven test hypothesis
Arguably the most valuable tip Aagard offered during his hour-long webinar was to formulate a data-driven test hypothesis.
“I used to be one of those people that just tested random ideas. I got excited and woohoo! Would run a test, no need for any documentation here. Pretty silly.”
The five things you need to put into a proper test hypothesis? He listed them out:
- Why do we think we need to make a change?
- What is it that we want to change?
- What impact do we expect to see?
- How will we measure this impact?
- When do we expect to see results?
Once these questions are answered, the information can be applied to a cold, hard hypothesis that you can refer back to and prove true or false. It can also help keep you on track when discussing the experiment with co-workers and clients. See his example template below:

Tip 5: Learn Statistics
For Aagard’s last point, he stressed that successful marketers are not only talented creatives, but also talented statisticians. Whether it is an A/B test, or any other type of campaign, the better the marketer is at interpreting and reporting on data, the more value the campaign brings to clients.
“You can manipulate data to show you anything, and confirmation bias is a real thing. You shouldn’t by cynical of your data, but you should be critical.”
He ended his Mozinar by reminding his audience that the purpose of A/B testing is not to PROVE you are right, but rather to see IF you are right. If you follow these tips, you’ll likely enjoy better fish sticks.