The Top 8 SEO Metrics & KPIs You Have To Track

SEO success is often considered a difficult thing to track, but it shouldn’t be. There are certain metrics and SEO KPIs (Key Performance Indicators) that nearly every site should be tracking to gauge the success of your SEO efforts.
Here are the top 8 SEO metrics we think every digital marketer and agency should be tracking:
- Leads &/Or Sales
- Organic Traffic
- Keyword Rankings
- Backlinks/Referring Domains
- Bounce Rate
- Pages Per Session
- Average Page Load Time
- Organic Clickthrough Rate (CTR)
Let’s break down each of these KPIs. By the end of this post, you will know exactly what each of these are, why they matter, and how to track them. Before we get started though, make sure you have Google Analytics set up on your site, or many of these metrics will be unavailable.
1. Leads &/Or Sales
Your website should support your business, and in some cases it may be your entire business! Therefore, your website needs to either collect leads if it’s a lead gen site, or sell products if it is Ecommerce. Either way, without leads or sales your business can’t survive, so tracking your SEO campaign’s impact on them is critical.
Leads
Let’s start with lead gen websites. Typically lead gen sites will push visitors to fill out some kind of form that includes the person’s name, phone number, and email address. The business then uses that contact information to qualify the lead and see if they are a good fit for the product/service.
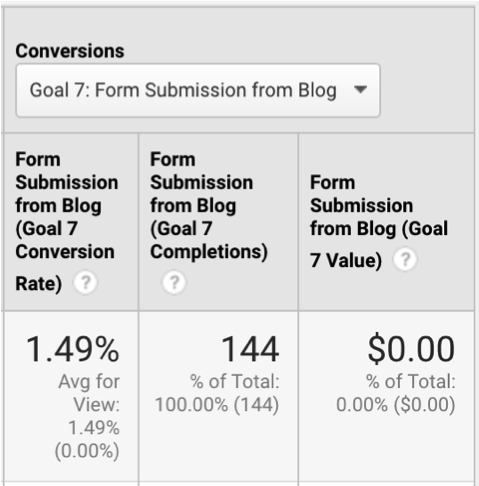
To track leads, you’ll need to measure form completions. If the completion of the form on your site takes the visitor to a unique landing page, like a ‘thank you’ page, you can just setup a Destination goal in Google Analytics to see how many people reach that page.
While this will work most of the time, there are some issues that can arise. One common issue is that websites often don’t de-index these ‘thank you’ pages, meaning the pages can sometimes rank for terms, leading to false positives. Another issue is that if the form can be submitted without filling in all fields, you could get leads that are impossible to follow up on.
To avoid this problem, I would recommend tracking form completions via Google Tag Manager (GTM). Rather than walking you through this process here, I highly recommend checking out this excellent guide on form tracking via GTM from Simo Ahava’s blog.
To see Goal completions in Google Analytics, go to Acquisition>All Traffic>Channels, and then click on the Organic Search channel group.
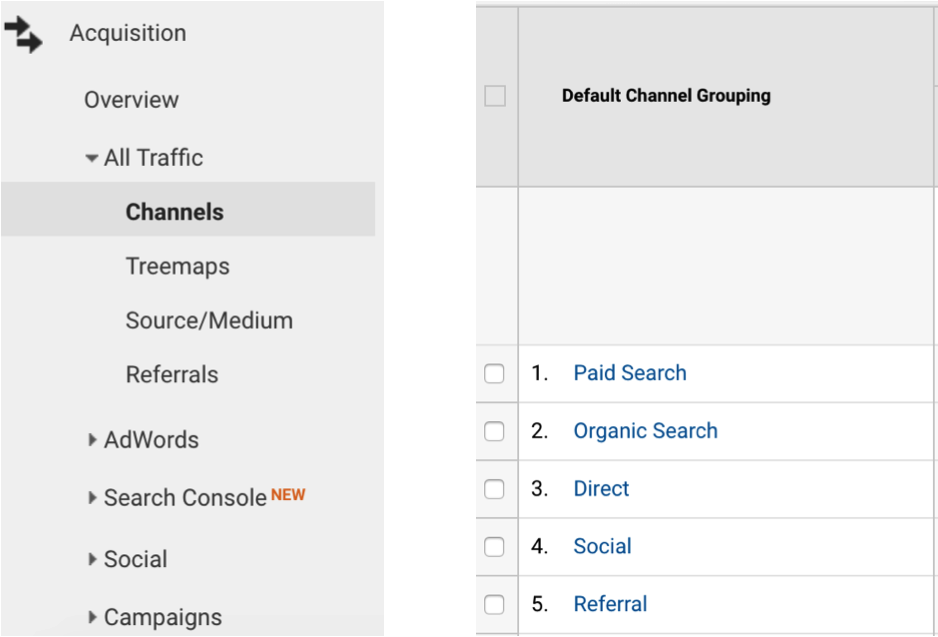
Then scroll to the right, and choose the Goal completions you want to see.
Sales
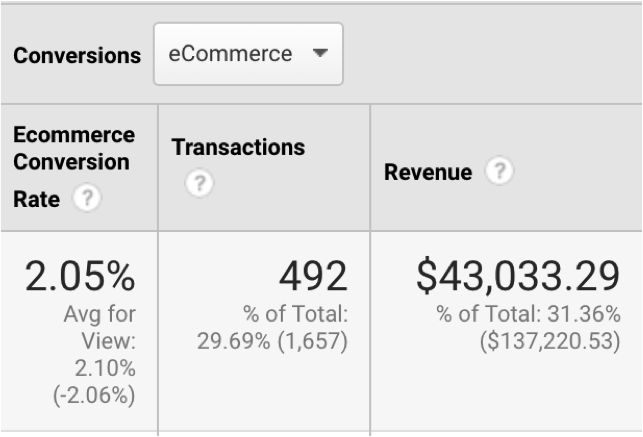
To track sales on your online website, you should set up Ecommerce tracking in Google Analytics. There are two types of tracking available: standard Ecommerce tracking, and enhanced Ecommerce tracking. From Google:
- Standard Ecommerce reports in Google Analytics allow you to analyze purchase activity on your site or app. You can see product and transaction information, average order value, Ecommerce conversion rate, time to purchase, and other data.
- Enhanced Ecommerce adds functionality by allowing you to see when customers have added items to their shopping carts, when they have started the checkout process, and when they have completed a purchase. You can also use Enhanced Ecommerce to identify segments of customers who are falling out of the shopping funnel.
Whatever you decide to go with, we recommend implementing via Google Tag Manager. Check out Google’s guide to Ecommerce Tag Manager implementation here.
Once that is set up you can go to Google Analytics and see all of your Ecommerce information by traffic type.
2. Organic Traffic
As you might expect, one of the principal goals of an SEO campaign is to drive more traffic to your site from organic search. After all, traffic from organic search is free. So, how can you see how your organic traffic is doing?
Head back to Google Analytics, Acquisition>Channels>Organic Search and you’ll see Sessions as the first column. That’s the number you want to look at; sessions are defined by Google as “a group of interactions that take place on your website within a given time frame.”
To measure success, you’ll want to compare time periods. I typically look at 3 different time frames when evaluating the performance of my campaigns: week-over-week data, month-over-month data, and year-over-year data.
- Week-over-week data lets you see how your traffic has changed in the short term. It’s useful to look at this when you are doing something major on the website, such as launching a major content campaign, installing HTTPS, or setting up a significant amount of 301 redirects.
- Month-over-month data is useful when you want to see the longer-term effects of your SEO campaign. Because Google’s algorithms change quite often, only looking at week-over-week data can make it hard to draw conclusions. Not to mention, SEO is inherently a slower process than other marketing efforts so most of the time you won’t see the effects of launching a new blog post or tweaking title tags until a month (or several!) have passed.
- Year-over-year data is important because it is the only true “apples to apples” timeframe comparison. It is useful for evaluating the long-term trends of your campaign. YoY data is also important when your business is strongly impacted by seasonality. For example, if your business sells winter clothing, comparing the organic traffic you receive in March vs. February will make it seem like your SEO campaign took a major dive, while in reality the search volume for the keywords your rank for simply declined.
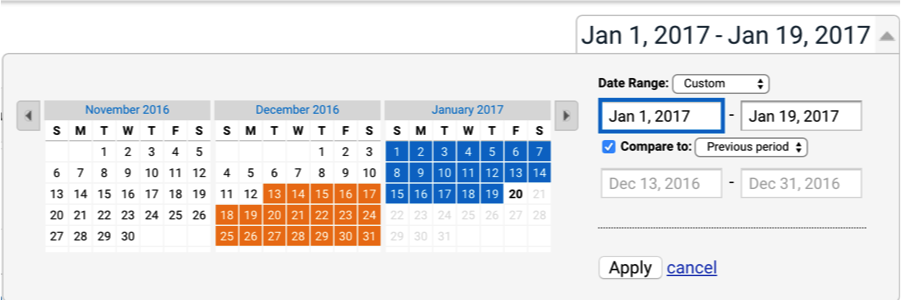
To view this data, go to the top right corner of the Organic Search page and click on the date drop-down menu.

Then you can set the date range that you want to compare.
3. Keywords
We’ve finally made it to the classic SEO KPI (Key Performance Indicator), keyword rankings. Ranking well for important keywords is a critical part of any SEO campaign, as high keyword rankings will help drive more traffic to the website.
There are plenty of great tools out there that will help you conduct keyword research, and then track your site’s rankings for them over time. At Wpromote we use what we consider the best keyword/content platform out there, BrightEdge.
You can also look at Google Search Console to see the keywords that are driving traffic to your website. Because Search Console is a free platform, I strongly recommend setting your website up on it if you haven’t already.
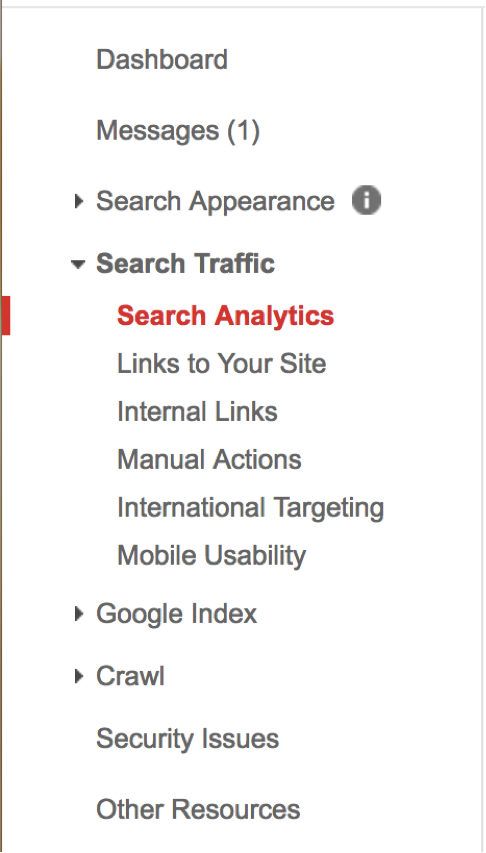
To see the keywords in Search Console, go to Search Traffic>Search Analytics.
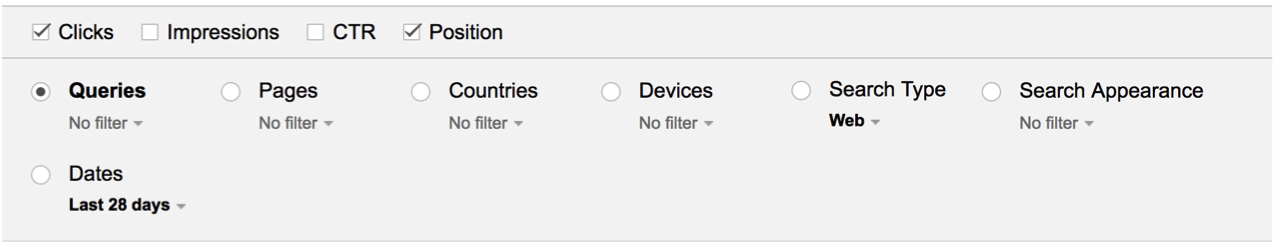
While you can do a lot of cool things with this report, if you’re just interested in keywords, tick off the Queries, Clicks, and Position boxes. This will show your average organic position for the queries that drive the most organic traffic to your site.
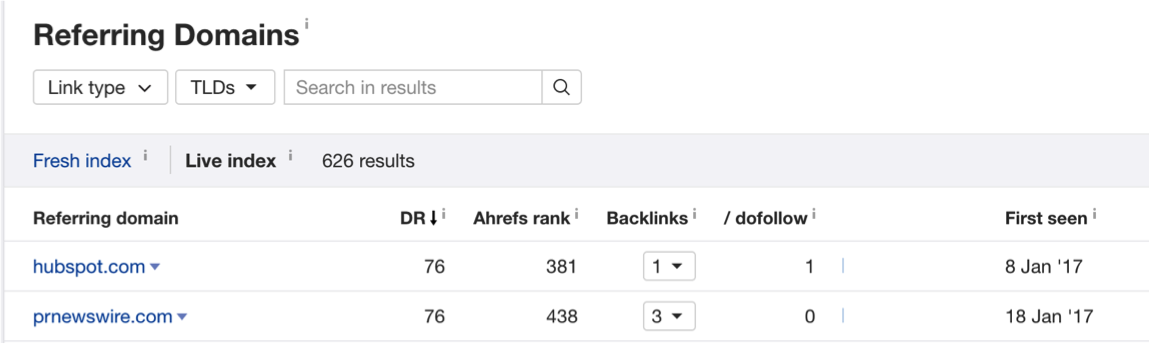
4. Backlinks & Referring Domains
Along with quality and relevant content, backlinks are the most important ranking factor in SEO. Because of this, it’s important that you track the backlinks pointing to your website. However, there are a couple of things to keep in mind when it comes to backlinks.
- The total number of backlinks matters. While it’s not uncommon to see a page with fewer backlinks outranking the competition, if you have 20 backlinks and the number 1 result has 20,000, you’re almost never going to outrank them.
- The relevancy and quality of the sites linking to you matters. If you sell medical devices and you are getting thousands of backlinks from a website that sells concert tickets, Google will likely consider these links to be spammy and may even penalize you for them (in which case you would want to disavow those backlinks). The same is true if you are receiving many links from spammy websites.
- The diversity of the referring (linking) domains matters. Search engines look at both total backlinks and how many different websites link to you. 10,00 backlinks from 500 websites is typically better than 2000 backlinks from 2 websites.
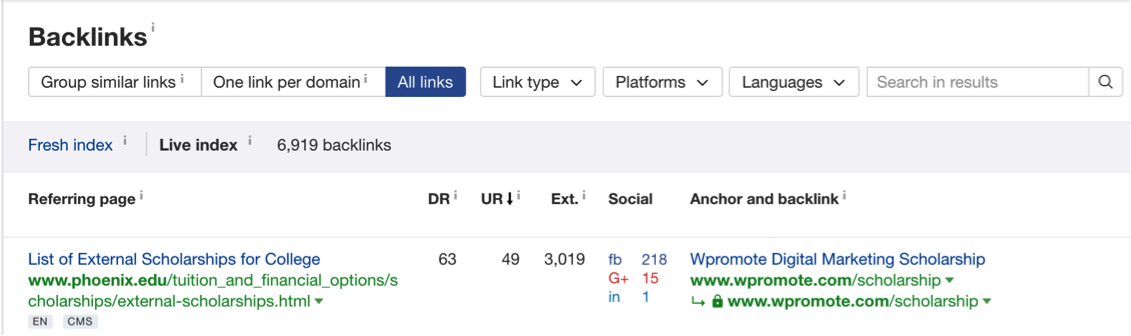
At Wpromote we consider Ahrefs to be one of the best tools for tracking backlinks and referring domains. With Ahrefs you can see all of the websites linking to you, where specifically they are linking to on your site, and the domain rating of these referring domains.
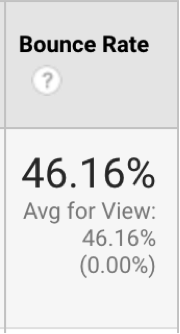
5. Bounce Rate
We’re heading back to Google Analytics! Bounce rate is defined as, “the percentage of single-page sessions (i.e. sessions in which the person left your site from the entrance page without interacting with the page).”
Bounce rate is one of the best ways of measuring user engagement on the site. A low bounce rate typically indicates that the user has found your website useful and/or interesting.
A high bounce rate on particular pages, such as top-of-funnel blog posts, isn’t necessarily a bad thing, as it could just be that the user’s search query was answered on that page and they are satisfied. That’s why setting up event tracking is key, to measure the success of a page even if you expect it to have a high bounce rate.
If you’ve noticed that key pages on your site, such as the homepage, have a high bounce rate, it is a clue that you should do further digging into things like PageSpeed, UX, and navigation.
To view bounce rate, go back to Acquisition>All Traffic>Channels. In the fourth column, you can see the overall bounce rate for each Channel (Organic, Paid, etc.)
To see the bounce rate for individual pages, go to Behavior>Site Content>All Pages.
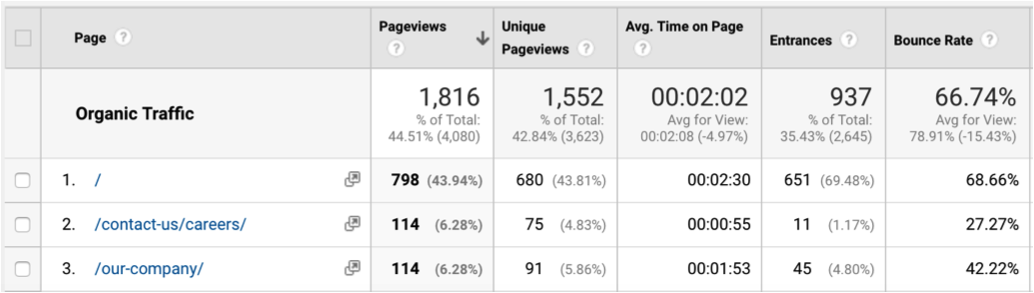
To see the bounce rate for individual pages from organic search you can stay on this page, you’ll just need to change the segment to Organic Traffic.
6. Pages Per Session
Pages Per Session is another important user engagement metric. The higher the number the better, as it means visitors are going to multiple pages on your website.
The reason we consider this metric to be important is because it’s a proxy for both how effective your navigation and site funnel is, and how engaging your content. If your Pages Per Session count is low it usually indicates that your content isn’t interesting enough for people to seek out other pieces. Or, it could show that navigation is poor and users don’t know how to find new content, so they just leave instead.
To see this metric, go to Acquisition>All Traffic>Channels and then look at the fifth column, right next to Bounce Rate. You’ll then be able to see Pages Per Session for each traffic channel.
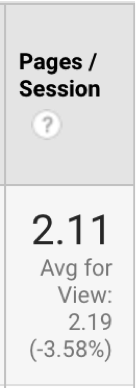
If you want to see how Pages Per Session changes amongst different groups of people, just change the active Segment, like we did with Bounce Rate.
7. Average Page Load Time
Our final SEO metric from Google Analytics is Average Page Load Time. Like this name implies, this metric looks at how quickly your pages load in the browser. Fast webpages are critical for user experience and SEO, particularly on mobile.
In Google Analytics, go to Behavior>Site Speed>Page Timings. From there, change the second column’s metric to Avg. Page Load Time (sec). You can then see your average load times for all pages, or use the search bar to check individual pages.
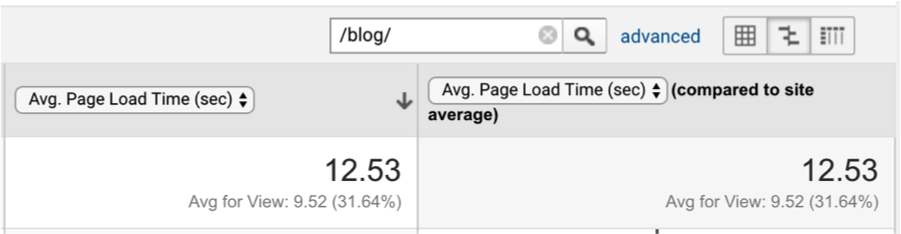
Faster load times are always better for SEO (and indeed, all channels), so try and make this time as low as possible. A good starting goal is to get under 10 seconds, and a stretch goal would be 3 seconds, especially for important pages.
To learn how to improve your PageSpeed and average load times, check out our site speed guide here.
8. Organic Clickthrough Rate (CTR)
Finally, another KPI you should be tracking is your site’s organic clickthrough-rate (CTR). You can find this information in the Search Analytics report in Google Search Console, and with the new Search Console beta, you can get information from the past 16 months!
Organic CTR is the percentage of clicks to impressions your website has in Google Search. So for example, if you had 100 impressions and 10 clicks, your CTR would be 10%.
The reason CTR is important is that if you can improve your CTR, you’ll almost certainly see an improvement in your keyword rankings. Think about it; if Google can see that more people are clicking on your website for a particular keyword than the other websites, it only makes sense that they would eventually rank your website higher.
So, what you want to do is go to the Search Analytics report, sort by pages, and then analyze the CTR of your most important pages. Try and find pages that you have keyword rankings for on Page 1, but you aren’t in the top 3 positions. Then, if the CTR is under 1%, make a note to experiment with that page’s title tag and meta description, with an emphasis on increasing clicks. Wait around 4 weeks, and then see if you saw any lifts in CTR and rankings. If not, try another test until you get it down.
Conclusion
While there are dozens of different metrics you should be tracking to evaluate your SEO campaign’s performance, we believe these are the 8 most important KPIs for SEO in 2018 that any digital marketing professional worth their salt should be on top of. If your SEO campaign needs any help improving any of these metrics, check out our University for helpful guides, or contact us directly here.


Responses