

Most B2B marketing teams say they measure ROI, yet remarkably few can actually explain how a media impression ultimately ties to revenue. The core tension is structural: Modern B2B buying journeys are long, multi-stakeholder, and deeply nonlinear. Forrester’s State of Business Buying, 2026 puts the typical buying decision at 13 internal stakeholders plus nine external influencers, 22 people in all, and that number climbs for larger or more strategic purchases.
In that environment, last-touch attribution is structurally incapable of capturing how influence accumulates across months of complex, multi-stakeholder engagement. A modern B2B measurement framework does three things. It ladders from business outcomes down to leading indicators. It connects each level to the next with historical conversion rates, so a leading indicator has a known value in pipeline terms. And it uses layered attribution and identity infrastructure to trace influence from impression to revenue.
Why Traditional B2B ROI Calculation Methods Fall Short
Most B2B attribution models were built for a simpler era of marketing that no longer exists, yet many organizations continue to measure ROI through B2B marketing measurement frameworks that fundamentally misrepresent how revenue is actually generated:
- Last-touch ignores upstream influence. In a typical B2B software deal requiring hundreds of touchpoints to close, last-click attribution captures only a fraction of the buyer journey. This leaves brand exposures, social interactions, and other influence moments entirely unmeasured, systematically undervaluing top-of-funnel programs that quietly drive pipeline.
- Lead-based measurement misses account dynamics. With 22 people shaping the typical decision, one individual’s form fill says almost nothing about where the account stands. Lead-based metrics treat that form fill as the primary signal and ignore the account-level engagement that actually moves the deal.
- Return on Ad Spend (ROAS) does not equal revenue impact in long sales cycles. The B2B buying journey stretches across months, with many marketers reporting difficulty measuring long-term campaign effects due to extended cycles. ROAS, a metric built for B2C where revenue is booked at the point of sale, measures immediate ad efficiency against actual dollars. In B2B, the value assigned to a conversion today says nothing about whether it influenced a deal that closes six months later.
The attribution problem compounds these issues. Google now defaults to Data-Driven Attribution (DDA) across its platforms, moving beyond rigid, rules-based models that assign credit based on predetermined heuristics rather than actual contribution. DDA uses machine learning to analyze each user’s unique journey and distributes credit based on observed impact.
However, even DDA has limits in B2B contexts, as it operates primarily within Google’s ecosystem and cannot capture the full complexity of multi-channel, offline-influenced buying journeys. If buying is nonlinear, measurement has to be layered.
A Three-Level Framework for Measuring ROI in B2B
To move beyond vanity reporting, B2B organizations must adopt a layered framework where every metric, from impression to revenue, explicitly rolls up to the level above it.This three-level structure cascades from business outcomes (revenue growth, profitability, customer lifetime value) down to the pipeline and revenue metrics that prove marketing’s contribution and finally to the leading engagement indicators that predict them. Laddering metrics this way answers the two questions executives actually ask: What did this activity contribute to revenue (lagging), and what will it contribute (leading)?
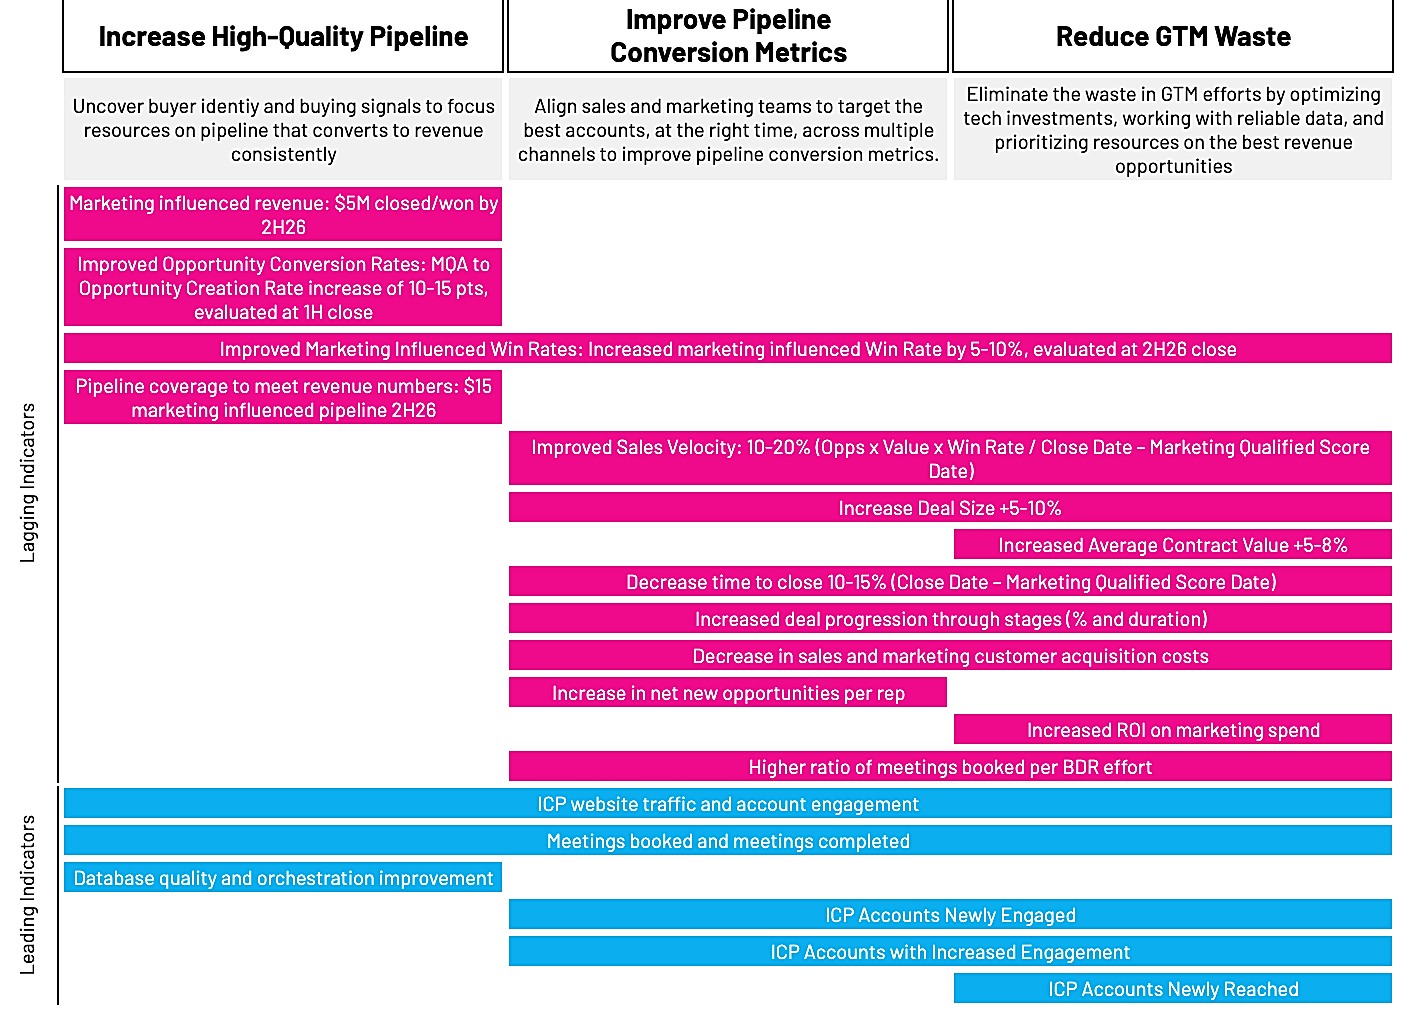
A sample measurement framework. Business goals (grow high-quality pipeline, improve pipeline conversion, reduce go-to-market waste) ladder down to lagging indicators, then to the leading indicators that predict them.
Level 1: Business Outcomes (C-Suite)
At the top of the framework sit the metrics that matter most to the boardroom. Every dollar spent on marketing must ultimately ladder up to enterprise-level goals. Examples of top-level pillar/goals are:
- Revenue growth: Every marketing investment must be defensible in terms of its contribution to the top line.
- Profitability: Leaders are prioritizing profitable acquisition over efficient acquisition, requiring visibility into the incremental impact marketing has on the bottom line.
- Customer lifetime value (LTV): Knowing which accounts and segments produce the most value over time tells marketing where to concentrate acquisition and expansion spend.
- Market expansion: Entry into new segments, geographies, or buying groups, where marketing’s first job is to build preference before demand exists.
Level 2: Lagging Indicators, Pipeline and Revenue (Marketing and RevOps)
At this level, the question shifts from “what did we spend?” to “what did we create?” These metrics look backward at what has already happened and translate marketing activity into the language of revenue operations. They are the financial proof points that show whether the investment paid off. Here are some examples of what you’d want to evaluate at this level:
- Qualified pipeline created with the total dollar value of sales-qualified opportunities sourced or influenced by marketing, measured at the account level rather than the contact level, since 22 people shape the typical decision.
- Pipeline velocity, answering the question “how quickly do qualified opportunities move through the sales cycle?” B2B customers now use an average of 10 interaction channels end to end, so velocity is a read on how well those channels work together.
- Opportunity creation rate that explains the rate at which marketing-sourced accounts convert to qualified opportunities.
- Net Revenue Retention, reflects marketing’s ability to expand relationships and capture wallet share.
- Closed-won revenue measures the total revenue from deals that closed and represents the ultimate validation of marketing contribution.
- Win rate—the percentage of opportunities that convert to closed-won—reveals whether pipeline quality is sufficient.
- Average deal size indicates whether marketing is attracting the right types of buyers.
- Customer acquisition cost includes the total marketing and sales spend divided by new customers acquired.
Level 3: Leading Indicators
These forward-looking metrics sit closest to the media and furthest from revenue. They are the earliest signals of buyer intent, and they let teams course-correct months before the lagging indicators confirm the outcome:
- Engaged accounts showing active buying signals across channels. These are early predictors of pipeline generation.
- High-value site behavior, which includes actions like solution page views or pricing inquiries. These indicators correlate with conversion likelihood.
- Content consumption depth, which refers to how much content a prospect consumes (e.g., multiple assets, demos, case studies) and signals research intensity and purchase intent.
- ICP accounts newly reached and newly engaged: Growth in the number of target accounts that have seen the brand and then taken a first action is the earliest predictor of next quarter’s pipeline pool.
What turns these three levels from a taxonomy into a measurement system is the conversion rate chain that connects them. Historical conversion rates from each level to the next tell you what every lower-level metric is worth in revenue terms. If 20% of qualified opportunities close at an average of $100,000, an opportunity is worth $20,000. If 10% of engaged accounts become opportunities, an engaged account is worth $2,000. Once that chain exists, leading indicators stop being soft metrics. You can forecast what engagement has to look like today to hit a revenue target nine months out, and you can feed those values back into bidding so platforms optimize toward pipeline instead of toward the cheapest form fill.
The chain also dictates where to optimize. Optimize for the highest-confidence signal you can access, ideally closed-won or opportunity value, and report at the level below it. If closed-won data can’t be piped back to the platforms yet, optimize for opportunities and validate against closed-won quarterly. Never optimize to platform conversions just because they’re the easiest data to get. That is how algorithms learn to chase the lowest-value leads.
Measuring Contribution Across the Full Journey
Modern B2B marketing measurement frameworks require a blended, multi-touch attribution approach, as no single model captures the full complexity of multi-channel, multi-stakeholder journeys. To estimate contribution accurately enough to drive smarter investment decisions — rather than to assign perfect credit — organizations should triangulate three complementary methodologies:
- Multi-touch attribution that tracks individual touchpoints across the journey. Algorithmic models, including Google’s data-driven attribution and Markov chain approaches, outperform rules-based heuristics because they estimate each touchpoint’s actual contribution rather than applying an arbitrary rule.
- Incrementality testing, which measures true cause and effect using holdout groups. Attribution alone cannot answer whether an activity caused revenue that would not have happened otherwise. This is also how brand impact can be measured in B2B: compare engaged visits, return visits, and conversion rates for target accounts exposed to upper-funnel media against a matched unexposed group. The lift is the brand’s contribution to demand.
- Media mix modeling, using historical data to estimate each channel’s impact on business outcomes, accounting for external factors like seasonality and macroeconomics.
The Role of Identity Resolution
You cannot measure impression to revenue without connecting anonymous engagement to known accounts. Identity resolution is the infrastructure that makes this connection possible:
- Links devices, channels, and sessions, unifying fragmented behavioral data into coherent account profiles
- Connects marketing activity to CRM records, bridging the gap between engagement data and revenue outcomes
- Enables account-level attribution, moving beyond contact-level views to reflect how buying groups actually decide
- Improves ROI modeling accuracy, creating the “single source of truth” required for reliable contribution estimates
Without identity resolution, B2B marketing measurement remains structurally incomplete.
From Dashboard to Decision-Making
True B2B ROI measurement is not a formula you plug into a dashboard; it is a structured framework that transforms how organizations invest, optimize, and align. Effective ROI measurement enables organizations to:
-
Guide budget allocation, directing spend toward channels and programs that actually drive revenue
-
Identify undervalued channels to reveal hidden contributors that deserve more investment
-
Accelerate pipeline velocity to expose friction points in the buyer journey
-
Align marketing and sales and create a shared view of contribution and accountability
The B2B ROI calculation method that holds up has four features:
- It is anchored in executive objectives that start with business outcomes, not tactical metrics.
- It’s powered by layered metrics connected by historical conversion rates, so every leading indicator has a known value in pipeline terms.
- It is modeled across the full journey, blending MTA, MMM, and incrementality for accurate contribution estimates.
- It’s supported by identity infrastructure that connects anonymous engagement to known accounts.
The dashboard is not the deliverable. Decisions are. If the framework can’t tell you what to scale, what to hold, and what to stop, it isn’t finished.
Build a B2B measurement framework that connects media investment to revenue. Talk to our team.