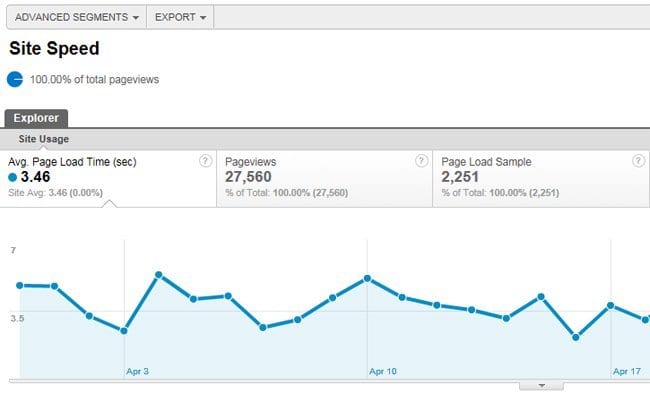
On Wednesday, May 4th, Google rolled out a new Analytics feature: Site Speed reporting. If you’re an Analytics nerd/data junkie like myself, this is exciting news.
Back in 2010 (on April 9th, to be specific) Google announced what many of us had already suspected – that site speed is a factor in their algorithm and can have a direct effect on your rankings.
From that point on, more and more webmasters started to take load time seriously. The weight of page speed (as a signal) in the overall scheme of things was ripe for debate. Some SEOs seemed to feel that it wasn’t very significant, but this was mostly speculation. Regardless, it was established that it was something that people needed to pay attention to.
Now that Google has implemented speed reporting directly into Analytics… Well, it’s pretty clear that everyone should be paying attention.
Webmasters can use the Site Speed report to measure load times across their sites. So how is this useful? Well, beyond the obvious benefit of having this useful data conveniently available in your analytics account, you can now view it in the context of other analytics data. A few ideas:
- View load time by page type
- Compare load time by geographic location
- Compare load time by ISP
- Compare load time by browser/operating system
- Compare load times of different mobile devices
- Compare load time of users that have logged in vs those that have not logged in
- View load time of your top pages – especially if these are pages where users can/should convert
- View the correlation between slow pages and conversion rates
…And optimize accordingly! These are just a few ideas. There’s plenty of room to get creative here.
In order to begin monitoring site speed in Analytics, you need to add one line of code to your Analytics tracking code snippet. If you run a WordPress blog, allow me to direct your attention here.
Reducing your page load time can range from very simple to very complicated, as there can be many variables involved, depending on how your site is setup. My personal favorite tool for diagnosing page speed issues is GTMetrix.
I was able to reduce the load time of my personal site from 3.66s (1.20 MB) to 1.17s (757 KB) by installing W3TotalCache and WP Minify and making a few minor tweaks.
The necessary steps for reducing page load time will vary greatly from one site to the next. Here’s a great starting point from SEOMoz: Optimizing Page Speed – Actionable Tips For SEOs and Web Developers.
At this time, the Site Speed report only records a sample of your visitors – “to minimize impact on overall site latency, this request is sent only on a sampling of pageviews to your site”. Also, the data won’t appear in your analytics right away. It should show up after a few hundred page views.


